Microservice Visualization | Datadog

Microservice Visualization

Visualize microservices at scale and analyze application performance with Datadog

It is critical to visualize microservices and their dependencies across your entire environment as you modernize your architecture and move workloads to the cloud. Datadog’s unified platform allows you to visualize your stack using a single pane of glass, reducing blind spots and speeding up troubleshooting.


900+ Turn-Key Integrations, Including

Visualize dynamic microservices in real time

Analyze your infrastructure and services from a bird’s eye view.
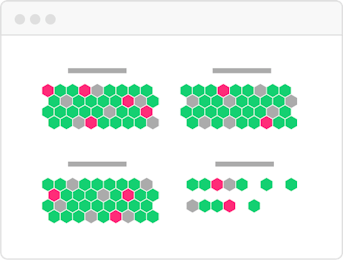
hostmap-infra-illustration.png

Host and Container Maps

Visualize the status of your servers or containers in a single view.
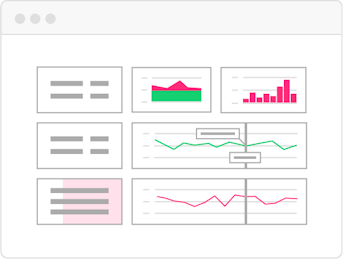
synchronized-dashboards-infra-illustration.png

Synchronized Dashboards

Track incidents across metrics with a common tagging structure.
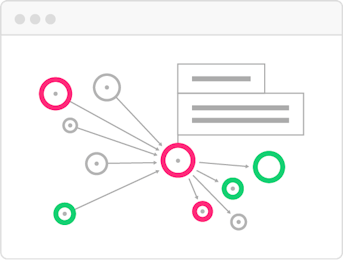
servicemap-apm-illustration.png

Service Map

Map application data flows and dependencies in real-time.

Loved & Trusted by Thousands

Washington Post logo 21st Century Fox Home Entertainment logo Peloton logo Samsung logo Comcast logo Nginx logo

Microservice Visualization Resources

Use these resources to learn microservice visualization best practices.

Microservices Monitoring with Datadog

Microservices and Container Research