Hybrid Multi-cloud Network Observability Reference Architecture
10월 15, 2025
Introduction
Modern enterprises increasingly rely on hybrid and multi-cloud environments to support distributed applications, dynamic workloads, and global operations. This complexity makes it difficult to gain deep visibility into networks that span on-premises infrastructure, multiple cloud providers, and software-defined networking solutions.
The Hybrid Multi-Cloud Network Observability Reference Architecture provides a blueprint for using Datadog’s Network Device Monitoring (NDM), Cloud Network Monitoring (CNM), Network Path, NetFlow, and other integrations (public cloud, network devices) to deliver unified network observability across hybrid environments. This architecture enables end-to-end visibility, correlation of network and application performance, and actionable insights for site reliability engineering, DevOps, network, application, and operations teams.
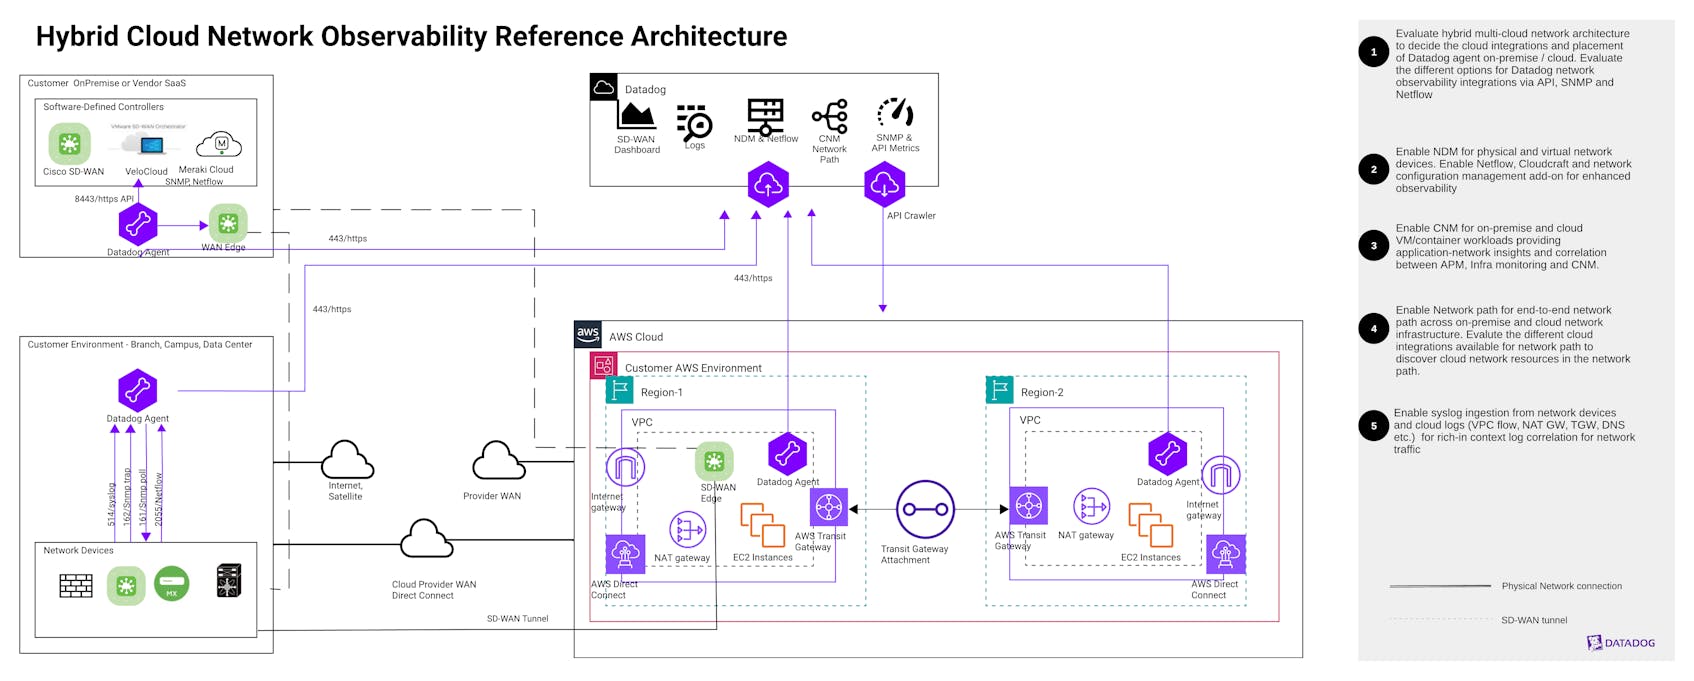
Explanation of the architecture
This architecture uses Datadog Cloud Network Monitoring (CNM), Network Device Monitoring (NDM), Network Path, NetFlow, device integrations via SNMP/API, and public cloud integrations (AWS, Google Cloud, Azure) to ingest, process, and provide network observability insights and root cause analysis of hybrid multi-cloud network infrastructure. To get a more integrated and unified full stack observability, customers can deploy infrastructure monitoring, APM monitoring along with digital experience monitoring via Synthetics and Real User Monitoring to have a holistic end-to-end observability solution of a hybrid multi-cloud infrastructure.
Step 1:
Assess the hybrid multi-cloud infrastructure that needs to be monitored and map the different infrastructure, application, and network components and how they connect. Then, you can map Datadog monitoring tools to monitor different environments:
- On-premises network
- Infrastructure: on-premises network devices (like WiFi access points, routers, switches, firewalls, SD-WAN/WAN edges, load balancers), on-premises infra hosts (bare metal, VM, k8s), and applications (Java, Python, Go, etc.)
- Datadog monitoring tools: NDM, CNM, Network Path, NetFlow, Logs (syslogs)
- Public cloud network
- Cloud network infrastructure: Connecting on-premises to cloud (direct connect, express route, VPN GW, etc.), cloud network resources (internet GW, NAT GW, transit GW, security groups, firewalls, etc.)
- Datadog network monitoring tools: cloud integrations, CNM-supported cloud resources
The Datadog Agent can be set up for NDM, CNM, NetFlow, Network Path, and cloud integrations.
Step 2:
Legacy network devices and software-defined network devices deployed as physical or virtual devices can be managed by Datadog NDM SNMP and API integrations. NDM supports out-of-the-box integration with most vendor network devices. Some of the key features of NDM for network observability are:
- Insights into the health and performance of on-premises, virtual, and software-defined network devices.
- Deep correlation of device and traffic insights for accelerated troubleshooting.
- Visualization of network topology and NetFlow traffic insights with built in topology modules and dashboards.
Step 3:
With Datadog CNM, all application and workload network calls can be intercepted and monitored for full mapping of all application-to-network flows. CNM can be deployed on-premises or via cloud hosts to provide end-to-end service dependencies with network latencies for all dependencies.
Some of the key features of CNM for network observability are:
- Application-to-network layer flow monitoring for deep TCP flow insights and DNS monitoring.
- Correlation between application and network layers to provide insights into service-to-service dependencies for faster root cause analysis.
- Network cost breakdowns for cloud environments across availability zones, cross-regions, or egress traffic.
Step 4:
Network Path serves as a transparent, data-driven diagnostic tool that bridges the gap between application performance and network behavior. It helps triage and resolve issues faster, while also reducing the common “finger-pointing” between application, network, infrastructure, and cloud teams.
With Network Path, teams can:
- Pinpoint root cause and localize degradation across hybrid cloud network paths.
- Visualize per-hop latency, packet loss, and path changes over time.
- Monitor paths between applications and/or service endpoints configured statically or discovered automatically.
Step 5:
Bringing network device syslog, cloud VPC Flow Logs, and other logs together with SNMP/API metrics, NetFlow records, and network paths turns point‑in‑time signals into an end‑to‑end picture of behavior across your WAN/LAN, data centers, and cloud networks. While metrics tell you what changed (symptoms), logs usually tell you why (events, config, state), and correlating them is the fastest route to root cause in hybrid environments.
Conclusion:
A holistic hybrid cloud network observability architecture solution with Datadog brings isolated KPIs together with a correlated, topology-aware, and tag-enriched view of how traffic flows and where it fails—whether that’s due to physical device faults, cloud config changes, internet path stability, or other causes. This convergence transforms monitoring into true observability for hybrid networks, enabling faster troubleshooting, better planning, and enhanced overall reliability of hybrid cloud network infrastructure.
Authors
Ripin Checker, Senior Product Solutions Architect
References
Datadog Network Device Monitoring
Datadog Cloud Network Monitoring
Datadog Network Path
Datadog NetFlow Monitoring