
What is Network Monitoring?
Network monitoring tracks the health of a network across its hardware and software layers. Engineers use network monitoring to prevent and troubleshoot network outages and failures. In this article, we’ll describe how network monitoring works, its primary use cases, the typical challenges related to effective network monitoring, and the main features to look for in a network monitoring tool.
How Does Network Monitoring Work?
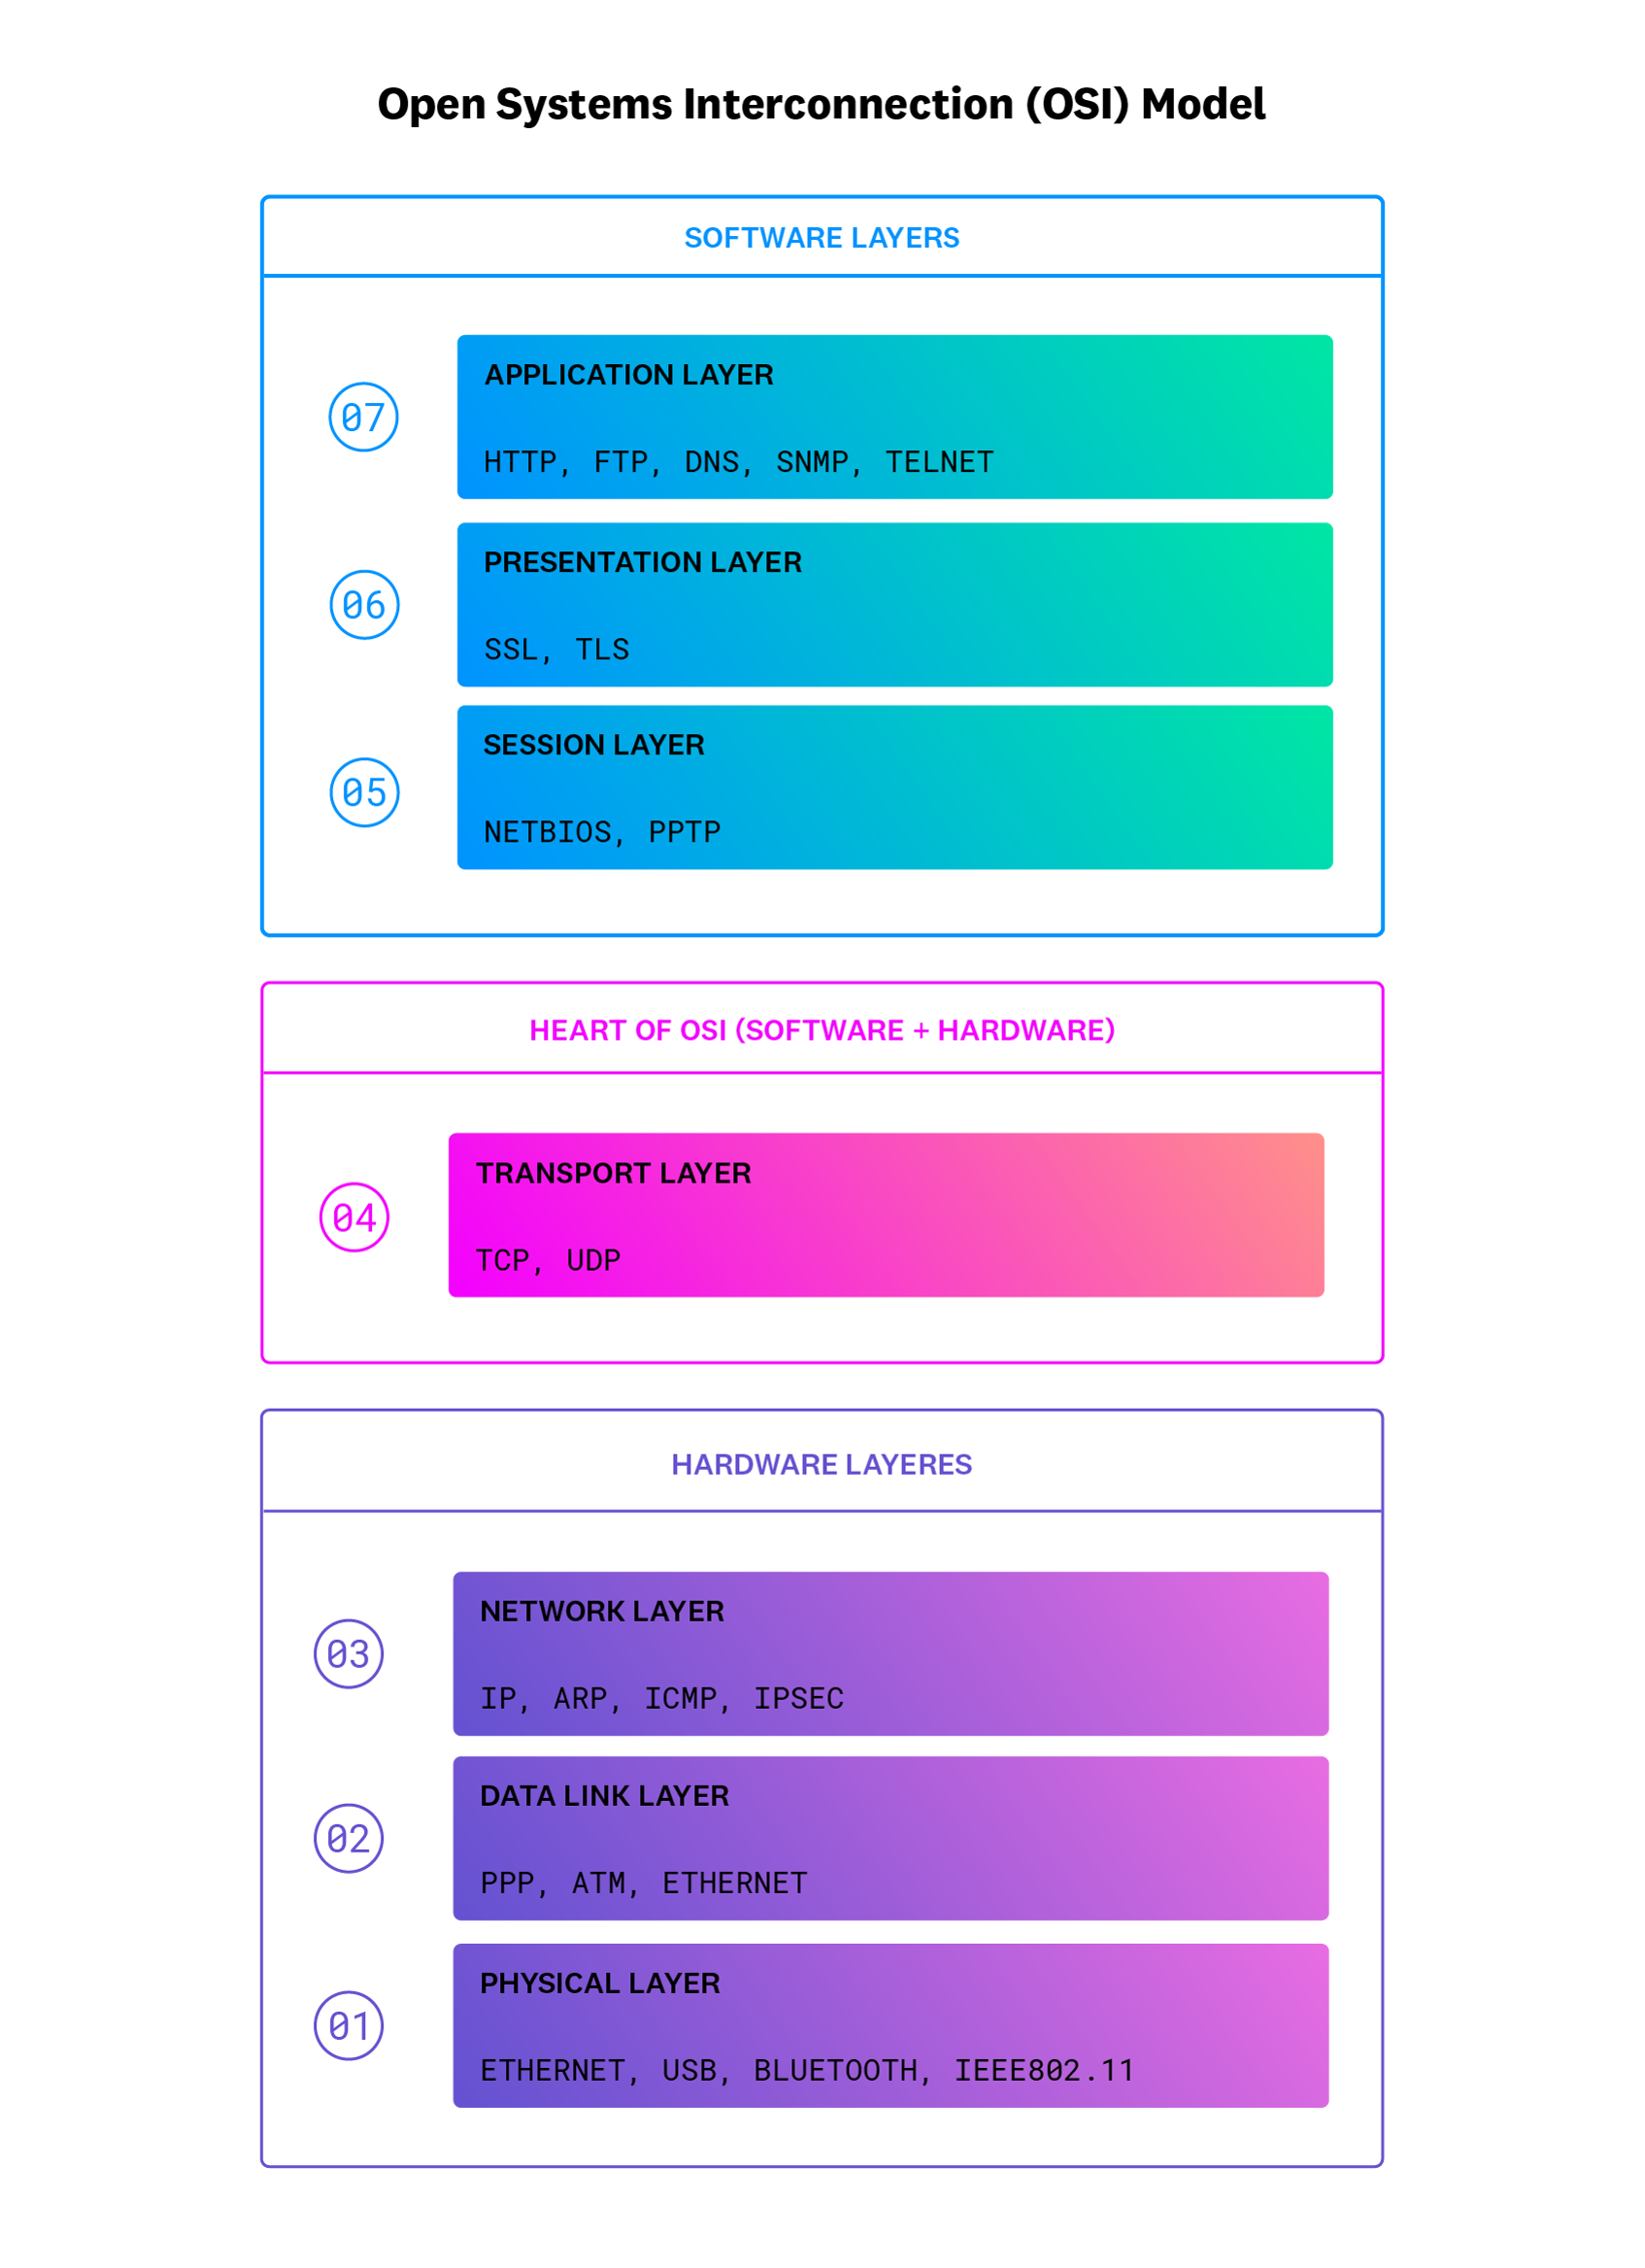
Networks enable the transfer of information between two systems, including between two computers or applications. The Open Systems Interconnection (OSI) Model breaks down several functions that computer systems rely on to send and receive data. In order for data to be sent across a network, it will pass through each component of the OSI, utilizing different protocols, beginning at the physical layer and ending at the application layer. Network monitoring provides visibility into the various components that make up a network, ensuring that engineers can troubleshoot network issues at any layer in which they occur.
Monitoring Network Hardware
Companies that run on-prem workloads or manage datacenters need to ensure that the physical hardware through which network traffic travels is healthy and operational. This typically comprises the physical, datalink, and network layers in the OSI model (layers 1, 2, and 3). In this device-centric approach to monitoring, companies monitor the components for transmitting data, such as cabling, and network devices such as routers, switches, and firewalls. A network device may have multiple interfaces that connect it with other devices, and network failures may occur at any interface.
How to Monitor Network Hardware
Most network devices come equipped with support for the Simple Network Management Protocol (SNMP) standard. Via SNMP, you can monitor inbound and outbound network traffic and other important network telemetry critical for ensuring the health and performance of on-premise equipment.
The Internet Protocol (IP) is a standard used on almost all networks to provide an address and routing system for devices. This protocol allows information to be routed to the correct destination over large networks, including the public internet.
Network engineers and administrators typically use network monitoring tools to collect the following types of metrics from network devices:
- Uptime
The amount of time that a network device successfully sends and receives data.
- CPU utilization
The extent to which a network device has used its computational capacity to process input, store data, and create output.
- Bandwidth usage
The amount of data, in bytes, that is currently being sent or received by a specific network interface. Engineers track both the volume of traffic being sent, and the percentage of total bandwidth that is being utilized.
- Throughput
The rate of traffic, in bytes per second, passing through an interface on a device during a specific time period. Engineers typically track throughput of a single interface, and the sum of the throughput of all interfaces on a single device.
- Interface errors/discards
These are errors on the receiving device that cause a network interface to drop a data packet. Interface errors and discards can stem from configuration errors, bandwidth issues, or other reasons.
- IP metrics
IP metrics, such as time delay and hop count, can measure the speed and efficiency of connections between devices.
Note that in cloud environments, companies purchase compute and network resources from cloud vendors who maintain the physical infrastructure that will run their services or applications. Cloud hosting therefore shifts the responsibility of managing the physical hardware onto the cloud vendor.
Monitoring Live Network Traffic
Above the hardware layers of the network, software layers of the network stack are also involved whenever data is sent over a network. This mainly involves the transport and application layers of the OSI model (layer 4 and layer 7). Monitoring these layers helps teams track the health of services, applications, and underlying network dependencies as they communicate over a network. The following network protocols are especially important to monitor because they are the foundation for most network communication:
Application Layer (Layer 7)
- Hypertext Transfer Protocol (HTTP)
The protocol used by clients (typically web browsers) to communicate with web servers. Primary HTTP metrics include request volume, errors, and latency. HTTPS is a more secure, encrypted version of HTTP.
- Domain Name System (DNS) The protocol that translates computer names (such as “server1.example.com”) to IP addresses through the use of various name servers. DNS metrics include request volume, errors, response time, and timeouts.
Transport Layer (Layer 4)
- Internet Protocol (IP) - Transmission Control Protocol (TCP)
A protocol that sequences packets in the correct order and delivers packets to the destination IP address. TCP metrics to monitor may include packets delivered, transmission rate, latency, retransmits, and jitter.
- User Datagram Protocol (UDP) UDP is another protocol for transporting data. It offers faster transmission speeds, but without advanced features such as guaranteed delivery or packet sequencing.
How to Monitor Live Network Traffic
Network monitoring applications may rely on a variety of methods to monitor these communication protocols, including newer technologies such as extended Berkeley Packet Filter (eBPF). With minimal overhead, eBPF tracks packets of network data as they flow between dependencies in your environment, and translates the data into a human-readable format.
Network Monitoring vs. Network Management
Network monitoring tracks the health of a network across its hardware and software layers. Engineers use network monitoring to prevent and troubleshoot network outages and failures. In this article, we’ll describe how network monitoring works, its primary use cases, the typical challenges related to effective network monitoring, and the main features to look for in a network monitoring tool.
End-To-End Visibility Into Your On-Prem & Cloud Network
Benefits of Network Monitoring
Network failures can cause major business disruptions, and in complex, distributed networks, it’s critical to have complete visibility in order to understand and resolve issues. For instance, a connectivity issue in just one region or availability zone can have a far reaching impact across an entire service if cross-regional queries are dropped.
One common benefit of monitoring network devices is that it helps prevent or minimize business-impacting outages. Network monitoring tools can periodically gather information from devices to ensure that they are available and performing as expected, and can alert you if they are not. If an issue does arise on a device, such as high saturation on a specific interface, network engineers can act quickly to prevent an outage or any user-facing impact. For example, teams can implement load balancing to distribute traffic across multiple servers if monitoring reveals that one host is not enough to serve the volume of requests.
Another benefit of network monitoring is that it can help companies improve application performance. For example, network packet loss can manifest as user-facing application latency. With network monitoring, engineers can identify exactly where packet loss is occurring and remedy the problem. Monitoring network data also helps companies reduce network-related traffic costs by surfacing inefficient cross-regional traffic patterns. Finally, engineers can also use network monitoring to check if their applications can reach DNS servers, without which websites won’t load correctly for users.
Modern monitoring tools can unify network data with infrastructure metrics, application metrics, and other metrics, giving all engineers in an organization access to the same information when diagnosing and troubleshooting issues. This ability to consolidate monitoring data lets teams easily determine whether latency or errors stem from the network, code, a host-level issue, or another source.
Primary Use Cases for Network Monitoring
Some specific use cases for network monitoring include the following:
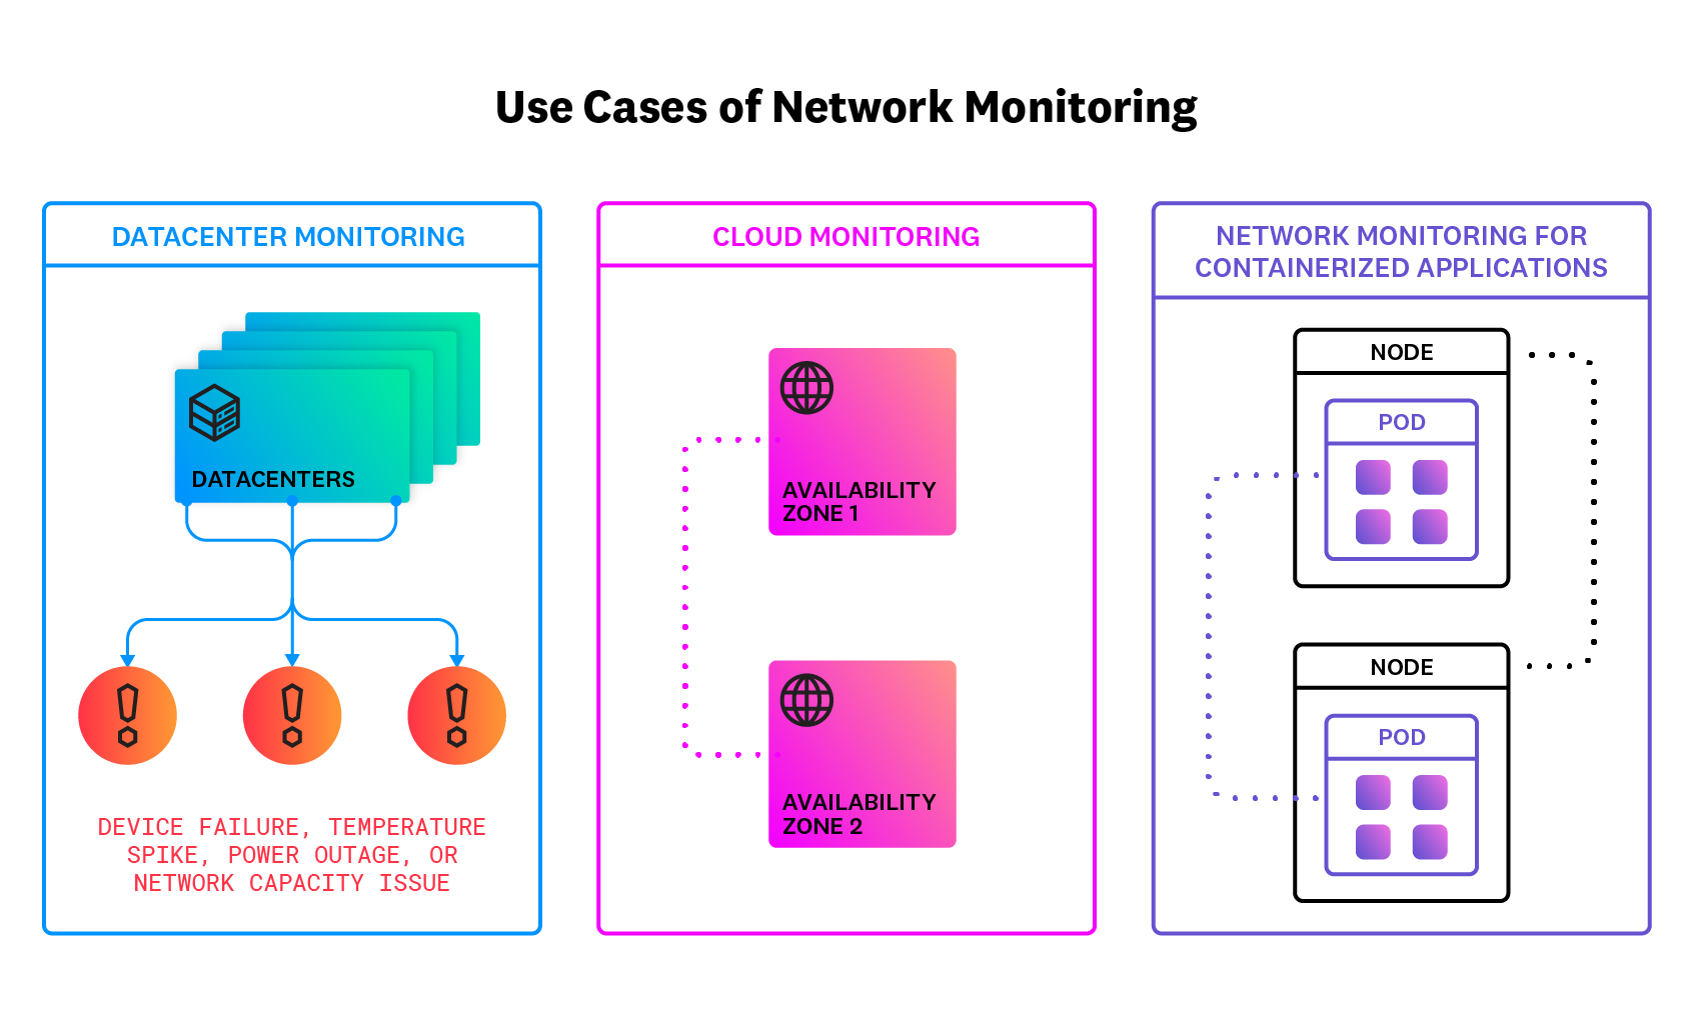
- Datacenter Monitoring
Network engineers can use network monitoring to collect real-time data from their datacenters and set up alerts when a problem appears, such as a device failure, temperature spike, power outage, or network capacity issue.
- Cloud Network Monitoring
Companies that host services on cloud networks can use a network monitoring tool to ensure that application dependencies are communicating well with each other. Engineers can also use network monitoring to help understand cloud network costs, by analyzing how much traffic is passing between regions or how much traffic is handled by different cloud providers.
- Network Monitoring for Containerized Applications
Containers allow teams to package and deliver applications across multiple operating systems. Often, engineers use container orchestration systems such as Kubernetes to build scalable distributed applications. Whether their containerized applications run on-prem or in the cloud, teams can use network monitoring to ensure that the different components of the app are communicating properly with each other.
Companies that embrace a hybrid approach in hosting their services may use network monitoring in each of these ways. In a hybrid approach, some workloads depend on internally managed datacenters, while others are outsourced to the cloud. In this case, a network monitoring tool can be used to get a unified view of on-premise and cloud network metrics, as well as the health of data flowing between both environments. It’s common to use a hybrid approach when an organization is in the process of migrating to the cloud.
Challenges of Network Monitoring
Modern networks are incredibly large and complex, transmitting millions of packets each second. In order to troubleshoot issues on a network, engineers traditionally use flow logs to investigate traffic between two IP addresses, manually log in to servers via Secure Shell Access (SSH), or remotely access network equipment to run diagnostics. None of these processes work well at scale, provide limited network health heuristics, and lack contextual data from applications and infrastructure that may shed light on the root cause of potential network issues.
Engineers also face challenges in network monitoring when companies move to the cloud. Network complexity increases because cloud workloads and their underlying infrastructure are dynamic and ephemeral in nature. Short-lived cloud instances may appear and disappear based on changes in user demand. As these cloud instances spin up and down, their IP addresses also change, making it difficult to track network connections using only IP-to-IP connection data. Many monitoring tools don’t allow you to monitor network connections between meaningful entities like services or pods. In addition, because the cloud provider provisions the network infrastructure, network issues are often out of the client’s control, forcing workloads to be moved to a different availability zone or region to avoid issues until they are fixed.
Network Monitoring Tools
Software-as-a-service (SaaS)-based solutions, such as Datadog, break down silos between engineering teams and bring a holistic approach to network monitoring. Datadog’s network monitoring products unify network data with infrastructure, application, and user experience data in a single pane of glass.
Network Device Monitoring (NDM) autodiscovers devices from a wide range of vendors and lets you drill down to monitor the health of individual devices. You can even proactively monitor device health with anomaly detection monitors for bandwidth utilization and other metrics.
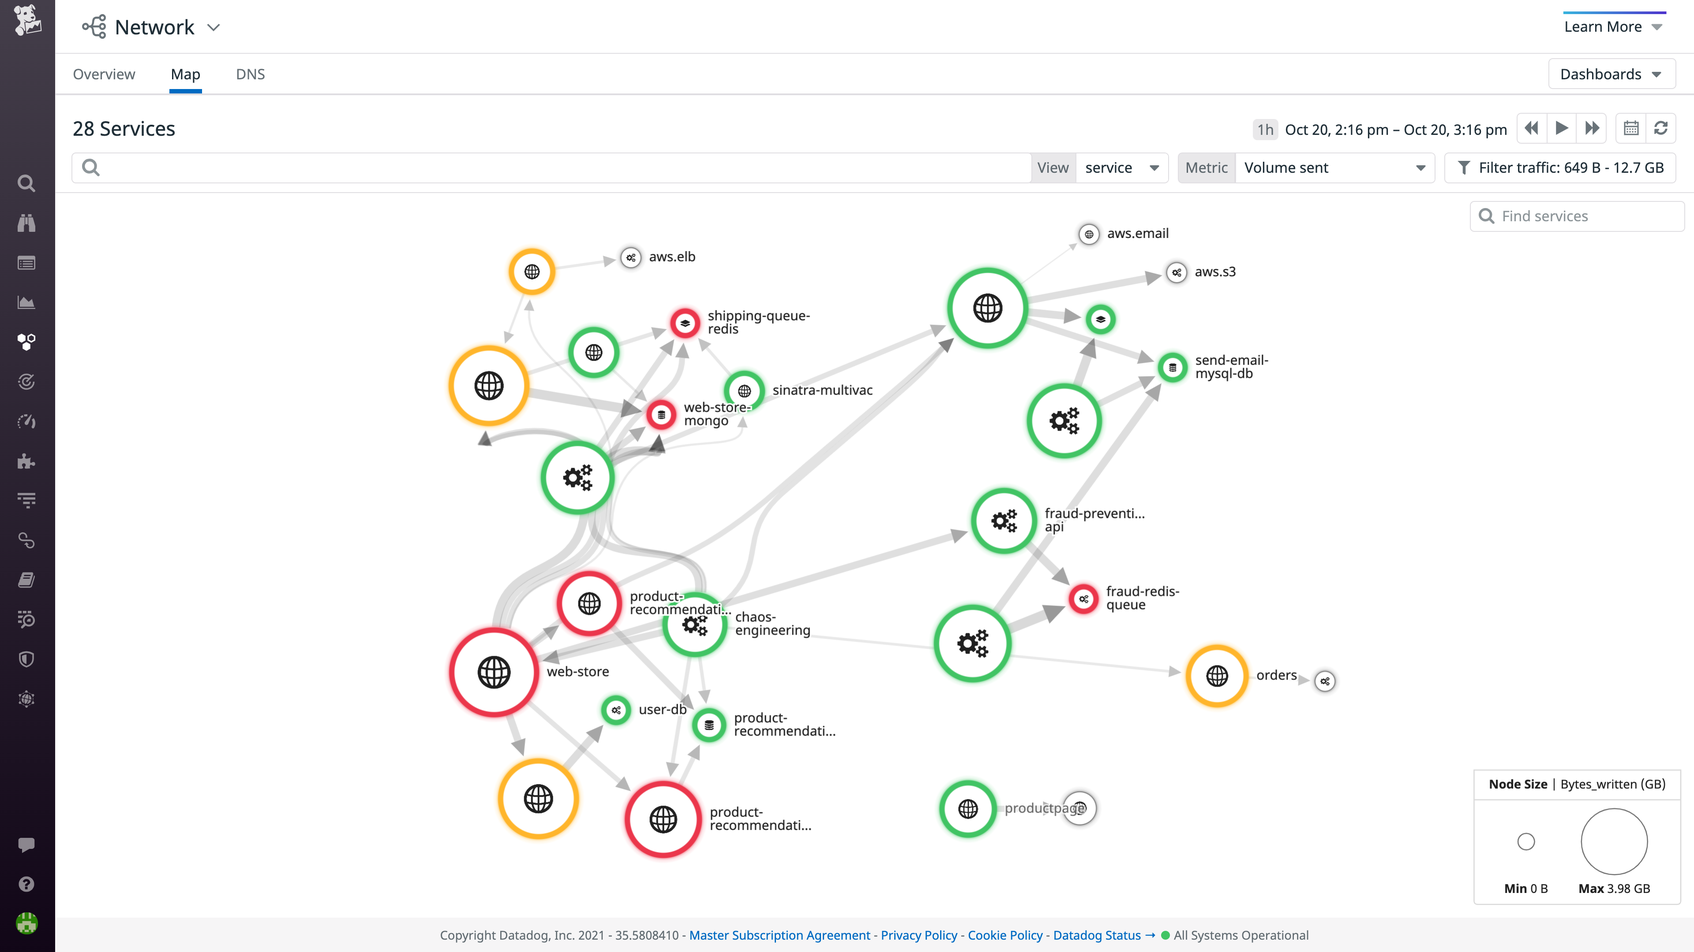
Cloud Network Monitoring (CNM) provides visibility into the rest of your network stack and analyzes traffic in real time as it flows across your environment. Teams can monitor communication between services, hosts, Kubernetes pods, and any other meaningful endpoints—not just IP connection data. And by tying network metrics together with other metrics and telemetry data, teams have rich context to identify and resolve any performance issue anywhere in their stack.
For additional insights from the perspective of end users, you can use Datadog Synthetic Monitoring. Synthetic tests allow you to determine how your APIs and web pages are performing at various network levels (DNS, HTTP, ICMP, SSL, TCP). Datadog alerts you to faulty behavior, such as a high response time, unexpected status code, or broken feature.