What is data usability?
Data usability refers to the ease with which data can be accessed, understood, and used to inform business decisions. It is one of the core data quality dimensions. Usable data is easy to find, accessible to its intended users, well-documented, and supported by clear, consistent definitions.
Even accurate and complete data can be difficult to use. For example, an analyst might find a dataset with undocumented fields or conflicting metric definitions across dashboards. Without enough context to interpret the data correctly, teams may spend additional time investigating its meaning, produce inconsistent reports, or make decisions based on incorrect assumptions.
Improving data usability involves making datasets easier to discover, understand, and work with. This includes maintaining documentation, establishing ownership, tracking data lineage, and monitoring the quality of data used in analytics and other downstream applications.
What makes data usable?
Data is usable when people can find, access, understand, and apply it to their work without unnecessary effort or ambiguity.
A dataset may also be suitable for one task but lack the detail needed for another. For example, monthly claims totals can support financial reporting but may not provide enough information to investigate individual claims.
Usable data has several key characteristics:
Discovery and access: Data is easy to find and available to its intended users through the appropriate tools and permissions.
Documentation: Tables, fields, and accepted values are documented so users can understand what the data represents and how to interpret it.
Semantic definitions: Metrics and business terms have shared definitions, including calculation rules, filters, and exclusions, so they are interpreted consistently across reports and dashboards.
Data lineage: Users can trace where data originated and how it was transformed, helping them determine whether it is appropriate for their intended use.
Ownership: Datasets have clearly identified owners responsible for maintaining them, answering questions, and coordinating fixes.
These characteristics make it easier for teams to find the right data and use it correctly.
What are examples of unusable data?
Common data usability problems include undocumented fields, inconsistent formats, unclear ownership, and conflicting metric definitions. These issues can make it harder for teams to interpret datasets, write accurate queries, and use the results of their analysis.
| Usability problem | Example | Impact |
|---|---|---|
| Undocumented values | A claim_status field contains codes such as P2 and X without explanations | Analysts interpret the same values differently |
| Unclear ownership | A dataset has no identified owner | Questions about its contents or intended use go unanswered |
| Inconsistent formats | Two systems store dates in different formats | Queries fail or produce incorrect results |
| Conflicting definitions | Two dashboards calculate open claims differently | Teams report different results for the same metric |
| Duplicate datasets | Several similarly named tables contain overlapping claims data | Analysts struggle to identify which dataset to use |
| Unexplained null values | A customer status field contains null values without documentation explaining their meaning | Analysts cannot determine how those records should be interpreted |
| Stale data | A dataset receives updates less frequently than its intended use requires | Reports or dashboards may present outdated information |
Example of unusable data in an insurance claims table
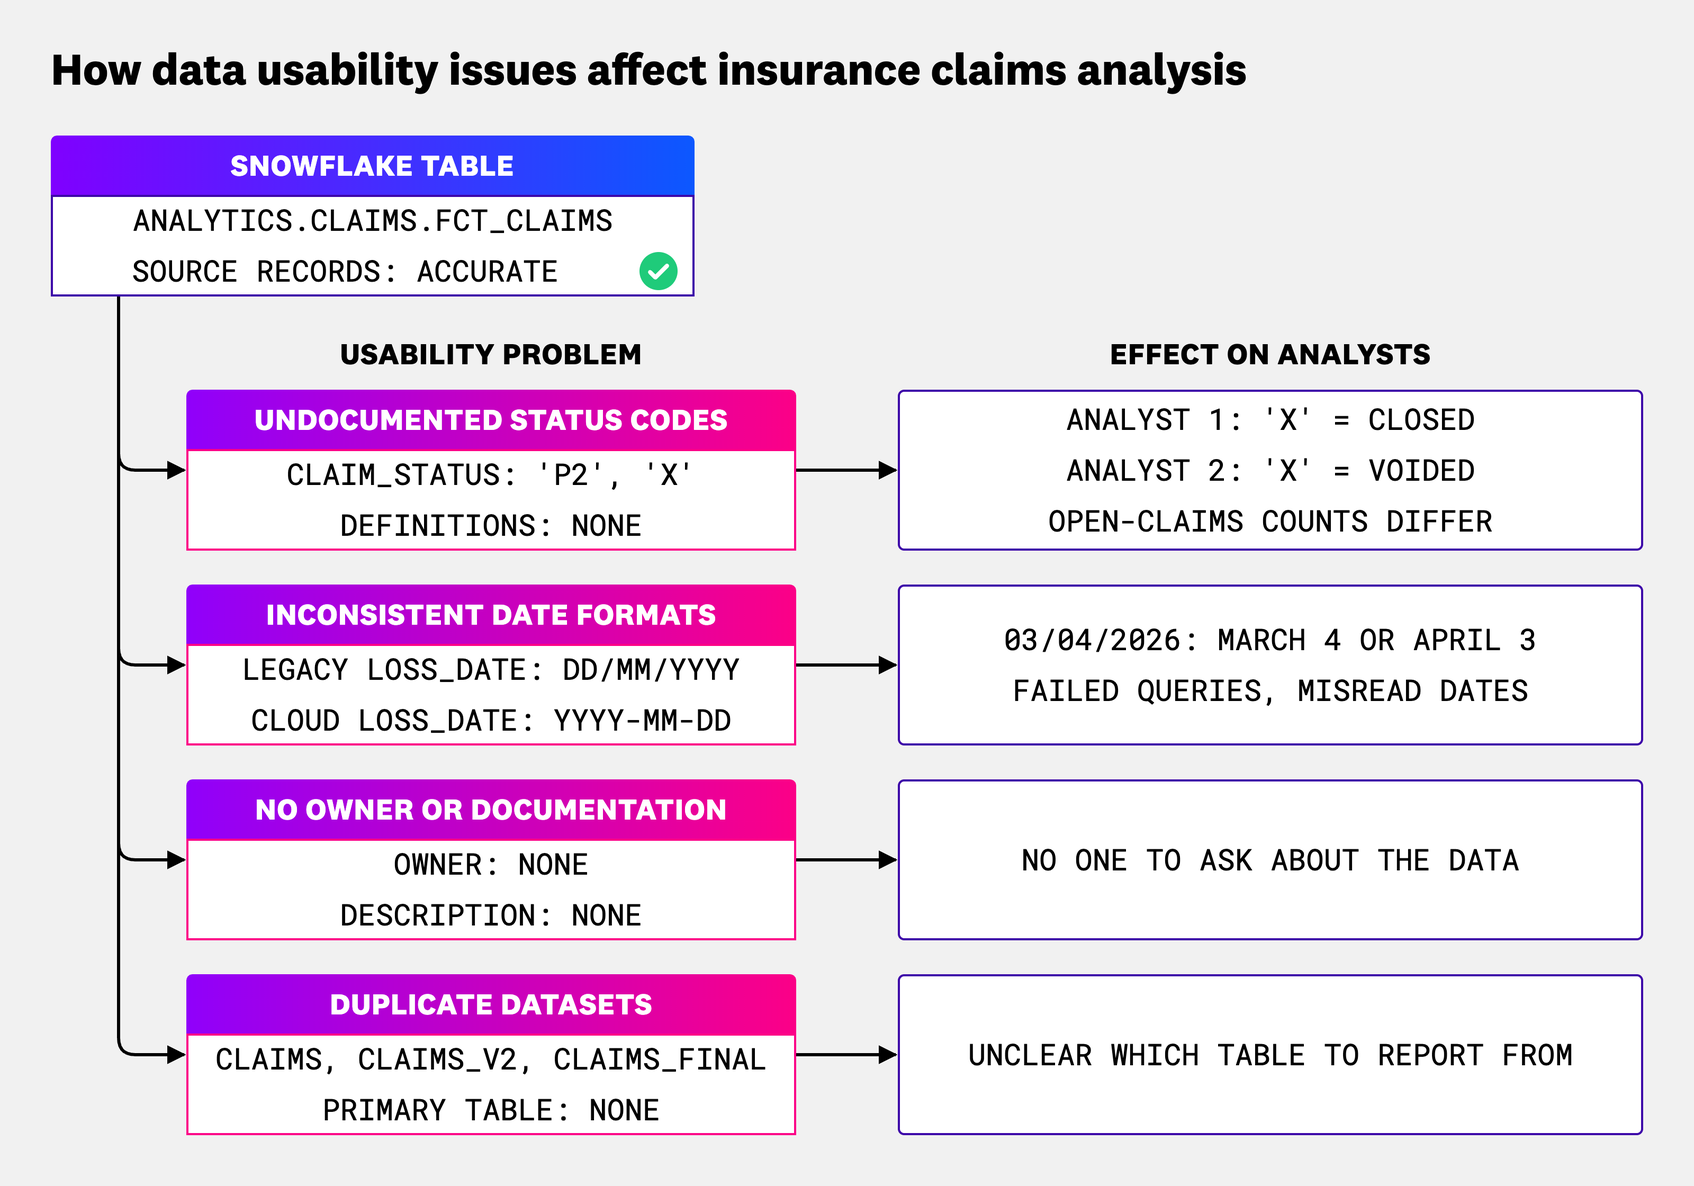
An insurance company combines claims data from a legacy claims system and a newer cloud platform in a Snowflake table called analytics.claims.fct_claims. Although the source records are accurate, analysts encounter several problems when working with the data.
The table contains several usability issues:
Undocumented status codes: The
claim_statusfield contains values such asP2andX, but their meanings are missing from the documentation. One analyst interpretsXas a closed claim, while another treats it as voided. Their reports produce different open-claims counts.Inconsistent date formats: The
loss_datefield stores dates asDD/MM/YYYYin the legacy system andYYYY-MM-DDin the newer platform. Without consistent parsing rules, queries may fail or interpret ambiguous dates incorrectly. This is one example of how data consistency problems can affect data usability.Missing ownership and documentation: The table has no documented owner or description, making it difficult for analysts to determine who can answer questions about its contents.
Duplicate datasets: Several similarly named claims tables exist without a clear indication of which one should be used for reporting.
To address these issues, the claims engineering team can take ownership of the dataset, document the status codes and field definitions, standardize date formats during data transformation, and identify the primary table for reporting. These changes make it easier for analysts to understand the data and use it consistently across reports and dashboards.
How do you measure data usability?
Teams measure data usability by looking at documentation and ownership coverage alongside how easily people can find, understand, and use data correctly. Metadata shows whether supporting information exists, while task completion and user feedback help reveal whether that information is useful. Because no single metric captures every aspect of usability, teams should use several measures together.
| Metric | How to measure it | Limitations |
|---|---|---|
| Tables with owners and descriptions | Percentage of tables with an assigned owner and a description | Ownership and descriptions alone don’t establish whether the information is accurate or useful |
| Column documentation coverage | Percentage of columns with descriptions or comments | A documented column may still have an unclear or outdated definition |
| Time to first query | Time between a user's access grant and their first successful query of a dataset | Query time can be affected by training, task complexity, and prior experience |
| Task completion rate | Percentage of users who successfully complete a defined analysis task using the dataset | Results depend on task difficulty, prior experience, and how success is assessed |
| Support questions per dataset | Number of questions about a dataset recorded in support tickets or help channels over a given period | Frequently used datasets may generate more questions even when they are well documented |
| Query failure rate | Percentage of queries involving a dataset that fail during a defined period | Query failures can result from syntax errors, permissions, or other issues unrelated to usability |
When measuring documentation and ownership coverage, focus on production tables and exclude scratch and deprecated tables. A table should have an assigned team responsible for maintaining it and addressing issues. Access permissions alone don’t establish ownership.
When comparing results over time, teams should account for changes in how datasets are used. Fewer support questions, for example, could mean fewer people are using the data rather than an improvement in usability.
Example of measuring data usability in Snowflake
Snowflake’s table and column comments can help teams measure documentation coverage. The following query identifies tables and views with missing descriptions and calculates the percentage of columns with comments.
Before running the query, select the relevant database. Results are limited to objects accessible to the current role and may include scratch or deprecated tables. Exclude those tables when calculating documentation coverage for production datasets.
-- Snowflake: documentation coverage per table and view in the current database
SELECT
   c.table_schema,
   c.table_name,
   MAX(CASE WHEN NULLIF(TRIM(t.comment), '') IS NULL THEN 1 ELSE 0 END) AS table_missing_comment,
   COUNT(*) AS column_count,
   SUM(CASE WHEN NULLIF(TRIM(c.comment), '') IS NULL THEN 1 ELSE 0 END) AS columns_missing_comment,
   ROUND(100.0 * SUM(CASE WHEN NULLIF(TRIM(c.comment), '') IS NOT NULL THEN 1 ELSE 0 END) / COUNT(*), 1) AS pct_columns_documented
FROM information_schema.columns AS c
JOIN information_schema.tables AS t
   ON t.table_catalog = c.table_catalog
   AND t.table_schema = c.table_schema
   AND t.table_name = c.table_name
WHERE c.table_schema <> 'INFORMATION_SCHEMA'
   AND t.table_type IN ('BASE TABLE', 'VIEW')
GROUP BY c.table_schema, c.table_name
ORDER BY pct_columns_documented ASC, column_count DESC;
The query identifies tables and views with missing descriptions and calculates the percentage of columns with comments. However, a comment counts as documentation even if it’s unclear or outdated. A high percentage doesn’t necessarily mean the documentation is useful. Teams should review the descriptions and confirm that users can understand the data and complete common analysis tasks.
How do you improve data usability?
Improving data usability starts with making it easier for people to find, understand, and work with the data they need. Teams should maintain documentation, assign clear ownership, standardize formats and definitions, and monitor data quality. These practices need to evolve as datasets, business requirements, and user needs change.
Teams can improve data usability in several ways:
Make datasets easier to find and access: Identify the primary table for common use cases and distinguish it from outdated or duplicate versions, for example by analyzing query history. Use a data catalog to document where datasets are located and how intended users can access them. Datadog’s Engineering team has described how it scaled self-serve analytics through shared data, discovery tools, and documentation.
Maintain documentation: Document what tables and columns represent, including accepted values, calculation rules, and known limitations. Keep descriptions current as schemas and business requirements change. Tools such as dbt support documentation for models, columns, and sources within the development workflow.
Standardize definitions and formats: Use consistent field formats and maintain shared metric definitions for the same intended use. For example, documenting which claim statuses count as open can prevent teams from calculating the same metric differently across dashboards.
Assign ownership: Identify the team responsible for each production dataset so users know where to direct questions and issues. Owners should maintain documentation, coordinate changes, and address problems affecting downstream users.
Track data lineage: Record how data moves between sources, transformations, and downstream systems. Data lineage helps teams understand where information originated, evaluate dependencies, and investigate problems introduced by upstream changes.
Monitor data quality: Track freshness, completeness, schema changes, and unexpected changes in data values. Automated monitoring can help teams detect problems that make datasets difficult to use, even when their documentation and ownership are established. These checks are also important because warehouse data quality problems can occur even when pipelines run successfully.
Review how people use the data: Look for recurring questions, difficulties accessing datasets, and problems completing common analysis tasks. Use that feedback to improve documentation, access, and definitions.
How does data usability differ from data accuracy?
Data quality describes whether data is fit for its intended use. Data accuracy and usability are two of its dimensions. Accuracy concerns whether the values are correct, while usability determines whether people can interpret and work with the data effectively.
| Comparison | Data quality | Data accuracy | Data usability |
|---|---|---|---|
| Question | Is the data fit for its intended use? | Are the values correct? | Can people find, understand, and use them? |
| Example failure | A claims dataset contains missing records, incorrect dates, and undocumented codes | loss_date records an incorrect date | 'X' in claim_status is undocumented |
| Example measure | A combination of measures for the dimensions relevant to the intended use | Error rate against a trusted source | Share of columns documented |
How does data observability support data usability?
Data observability helps teams identify changes that can affect how data is used, investigate their causes, and understand their downstream impact. Datadog Data Observability provides Quality Monitoring to track data freshness, row count, nullness, and other indicators of data health, and Jobs Monitoring to ensure the health and performance of data processing jobs. These monitors can detect delayed updates, incomplete data loads, and unexpected changes that affect downstream stakeholders.
Datadog Data Catalog also helps teams find datasets and review available metadata, including ownership information and upstream and downstream dependencies.
Teams can also use custom SQL monitors to detect problems based on specific business rules. For example, a monitor on the insurance claims table could use a query to count values outside the documented list of claim status codes and alert the responsible team when unexpected values appear.
Table- and column-level lineage helps teams trace problems through connected data sources and transformations to identify affected tables, dashboards, and reports. With configured notifications, alerts can reach the team responsible for investigating and correcting the issue. Teams can then use lineage to locate the source of the problem and determine which downstream outputs need to be checked after a fix.
Improve data usability with Datadog
As datasets and business needs change, teams need to keep documentation, definitions, and ownership current while monitoring for problems that affect downstream users.
Learn more about maintaining data quality across the full data life cycle with Datadog Data Observability.
FAQs
What is an example of data usability?
An example of data usability is a premium_amount column. It is usable when its description states the currency, whether taxes are included, and who owns it. It is unusable when analysts must guess and two dashboards report different premium totals.
Does a data catalog improve data usability?
A data catalog helps users find datasets and understand what they contain. However, its usefulness depends on the quality of its documentation. Data catalogs should include descriptions, ownership information, field definitions, and lineage, with metadata kept up to date as datasets change.
Is data usability the same as data accessibility?
No. Data accessibility refers to whether someone can locate and access data through the appropriate tools and permissions. Data usability also considers whether they can understand and use that data correctly. For example, an analyst may have access to a table but struggle to interpret its contents if the fields are undocumented.
Who is responsible for data usability?
Each production table should have a named owner who keeps documentation current and coordinates fixes. Business subject-matter experts confirm field meanings and metric definitions. Analytics engineers maintain transformations and implement agreed definitions. Governance or platform teams set standards and track coverage. Responsibilities may span teams, but ownership should be clear.
How can data usability be tested?
Teams can test data usability by asking intended users to complete common analysis tasks, such as finding a dataset, interpreting its fields, or calculating a metric. Tracking task completion, time spent, and user feedback can reveal problems with documentation, access, or definitions that metadata coverage alone might miss.