What is data freshness?
Data freshness measures how up-to-date a dataset is compared with how up-to-date it needs to be for its intended use. It’s one of the core data quality dimensions, with requirements that depend on how data is used. Fraud detection may require transaction data within seconds, while a daily business report may only need data through the previous day.
A dataset can be recently updated and still be missing expected data. Freshness checks help teams detect these gaps before people rely on outdated results. As part of data observability, those checks work alongside other measures of data quality and pipeline health.
Why does data freshness matter?
Data freshness is important because teams rely on up-to-date information to make decisions and automate business processes. When updates are delayed or missing, teams may continue using outdated information without realizing it.
For example, a marketing team may send discount codes to customers who have already made a purchase because its customer table is out of date. A campaign report missing recent conversions could also make return on ad spend (ROAS) look lower than it is, leading the team to cut spending on a campaign that is performing well.
These problems can be difficult to spot when pipeline jobs finish successfully. A completed job confirms that a process ran, but it does not establish that the report contains all the information needed for a decision. Monitoring data quality alongside pipeline health helps teams identify those gaps.
Data freshness vs. timeliness, recency, and latency
An on-time delivery or a recent update can make data appear fresh even when it is missing recent records. For example, a pipeline may finish on schedule but only reload older records. The distinction between freshness, timeliness, recency, and latency helps explain why checking when a job finished or a table changed is not enough to determine whether its data is up to date.
| Term | Question it answers | Measured against |
|---|---|---|
| Data freshness | Is the data current enough for its intended use? | The present moment and the acceptable age of the data |
| Data timeliness | Is the data available when it’s needed? | The task’s deadline |
| Data recency | When was the data last collected or updated? | The most recent collection or update timestamp |
| Data latency | How long after an event is the data available? | The time between the event and data availability |
For example, a table can arrive before a 6 a.m. reporting deadline and be timely for that report. By noon, the same data may be stale for an application that needs hourly updates.
How fresh does data need to be?
Freshness requirements can range from seconds to weeks. The acceptable delay depends on how quickly the source data changes and how soon people or systems need updated information.
| Freshness category | Typical lag | Common use cases |
|---|---|---|
| Real time | Seconds or less | Fraud detection, trading platform, IoT monitoring |
| Near real time | Minutes | Customer experience systems, operational dashboards |
| Hourly | Under 60 minutes | Intraday business reporting, campaign monitoring |
| Daily | Under 24 hours | Marketing attribution, financial reporting |
| Weekly or monthly | Days to weeks | Strategic planning, trend analysis |
Setting freshness requirements
Data teams should agree on freshness requirements with the people who use each dataset. The discussion should start with the decision or process that the data supports. An operational dashboard may need a maximum data age, while a daily report may need a complete reporting period available by a fixed deadline. In both cases, the requirement should identify which information must be available, rather than simply stating how often a pipeline runs.
A deadline should also leave time to investigate a delayed update before the data is needed. For example, data used in a 9 a.m. review might need to arrive by 8 a.m., giving the responsible team an hour to address a problem.
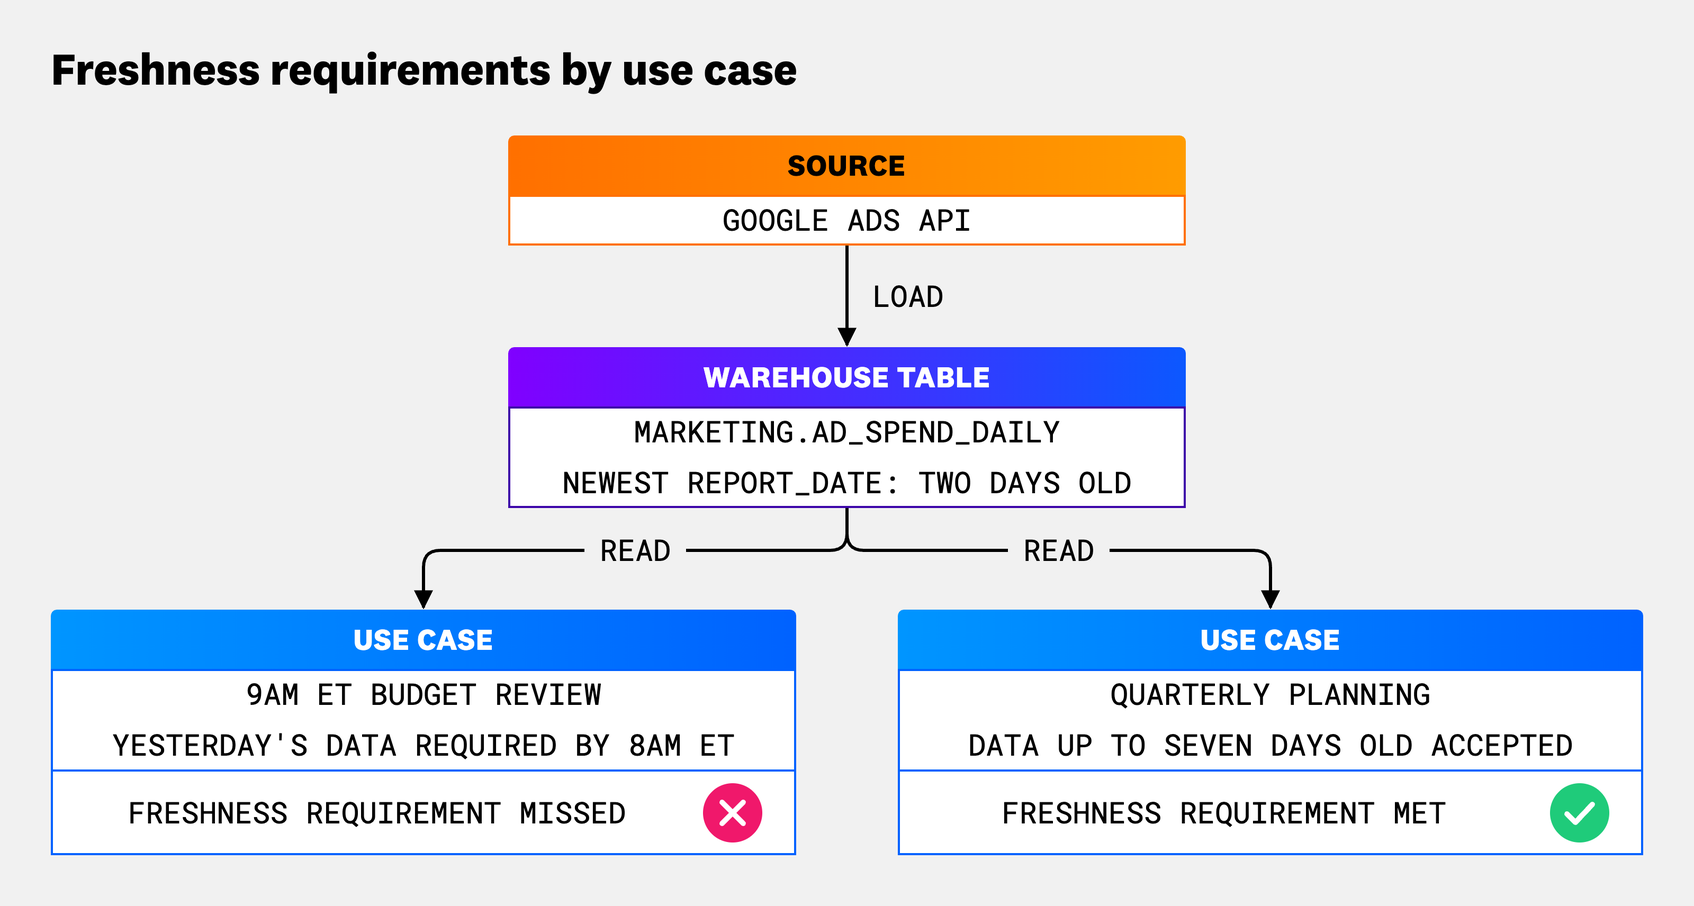
The pipeline’s usual delivery time helps determine whether it can meet that requirement. If a load regularly finishes too close to the reporting deadline, the team may need to start it earlier or reduce processing delays. Moving the freshness threshold to accommodate a slow pipeline would leave the original business need unmet.
Warnings should leave time to respond before the requirement is missed. For data that becomes too old after 30 minutes, a warning at 20 minutes could provide up to 10 minutes to investigate. The check schedule also needs to be frequent enough to detect the problem during that warning window.
Historical update patterns can provide a starting point. LinkedIn’s Data Health Monitor uses observed arrival times and frequencies to infer when new data is expected. Dataset consumers can then adjust those expectations to match their needs.
Teams can document the agreed requirement in a freshness service level agreement (SLA). Along with the acceptable data age or delivery deadline, the agreement should identify the dataset owner, how compliance will be measured, and who responds when an update is late.
How is data freshness measured?
A common way to measure data freshness is to calculate data age, the difference between the current time and the newest relevant timestamp in a dataset. Teams compare that age with the dataset’s freshness requirement to determine whether the data is stale.
For example, if the current time is 10 a.m. and the latest order recorded in a warehouse was placed at 9:20 a.m., the orders data is 40 minutes old. If the application requires order data no more than 30 minutes old, the dataset has exceeded that limit.
Choosing the right timestamp
The timestamp should match what the team needs to check. A timestamp showing when an order was placed answers a different question from one showing when it reached the warehouse.
Event timestamp: Records when something happened at the source, such as an order being placed. It helps teams assess how current the business activity represented in the dataset is.
Load timestamp: Records when data arrived in the destination. It helps detect interrupted loads, but a recent load can contain older events.
Table modification timestamp: Records when the table changed. Its meaning depends on the platform. For example, Snowflake’s
LAST_ALTEREDfield can change after data modifications, schema changes, or background metadata operations.
An older event timestamp does not always indicate a delivery problem. The source may simply have had no new activity. To distinguish the two, teams need evidence from the source, such as recent source records or ingestion logs. Destination timestamps alone cannot establish whether new events occurred.
When both event and arrival timestamps are available for the same records, their difference shows delivery latency. Data age answers how current the available information is, while delivery latency shows how long those records took to arrive. Comparing timestamps from unrelated records can produce a misleading result.
Timestamp checks also need consistent time zones and a defined response when the timestamp column is empty, contains nulls, or includes future dates. Otherwise, a calculation may fail to identify missing data or make the dataset appear newer than it is.
Checking for delayed or missing updates
The newest timestamp doesn’t show whether every expected update has arrived. Teams can combine timestamp measurements with checks on delivery times, update patterns, and related datasets.
| Method | What it reveals |
|---|---|
| Timestamp comparison | More time than expected has passed since the last relevant event or load |
| Source-to-destination lag | Data is taking longer than expected to reach its destination |
| Expected change pattern | A scheduled batch or partition hasn’t arrived |
| Related-dataset checks | One dataset has fallen behind another that normally updates alongside it |
The methods answer different questions. A timestamp check can reveal that updates have stopped, while an expected-delivery check can identify a missing daily batch. Comparing related datasets can help locate a delay, but a difference between them is a signal to investigate rather than proof of its cause.
Freshness checks also overlap with completeness checks when only part of an expected update arrives. Datadog’s engineering account of measuring data completeness at scale illustrates why checking what entered and exited a pipeline provides information that a recent timestamp alone cannot.
These checks may also need to run separately for important partitions or groups. For example, new records from one region can keep a table’s latest timestamp current while updates from another region have stopped.
The measurement point matters as well. A warehouse table may be current while a downstream transformation or dashboard is still waiting for an update. End-to-end data pipeline monitoring helps teams check whether fresh information reaches the system where it is used.
How do teams keep data fresh?
Teams keep data fresh by monitoring expected updates and fixing the problems that delay them. Each important dataset should have a named owner and an agreed response when an update is missed.
Monitoring expected updates
Freshness checks should run on their own schedule, independently of the pipeline jobs they monitor. If a job never starts, a check inside that job will never run either.
A fixed threshold checks whether data meets a known requirement, such as a maximum age of 30 minutes. A historical baseline can identify a different problem, such as a daily load arriving much later than usual even though it has not yet missed its deadline. Both can be useful, but normal behavior does not establish that a business requirement has been met. Checks should also account for expected gaps, such as a source that updates only on business days.
Responding to missed updates
Alerts should identify the affected dataset, how late an update is, and which reports or applications depend on it. They should reach the team responsible for the load, following an agreed incident management process for escalation and communication. If a deadline will be missed, the teams relying on the data should be told what is missing and when an update is expected.
The investigation should establish where delivery stopped or slowed down. An upstream API may have rejected requests, a scheduled job may still be waiting to run, or a transformation may be taking longer as data volumes grow. A successful load can also be incomplete, so the absence of a job failure does not end the investigation.
After correcting the cause, the responsible team should reload or backfill the missing records and verify that the affected downstream tables and reports have caught up. Recovery is complete when the expected information is available to its consumers, not simply when a retry succeeds.
For recurring delays, root cause analysis can help teams identify why the problem keeps returning and determine what needs to change.
Monitoring freshness with Datadog
Datadog Data Observability brings data quality, pipeline execution, and infrastructure signals together. Teams can use those signals to detect a freshness problem, investigate the jobs involved, and identify the reports or applications affected.
Quality Monitoring provides several ways to check whether expected updates have arrived.
Table freshness: Measures the time since a table was last updated. It is useful when table updates reliably represent new data arriving. Table freshness isn’t available for views or for warehouses that don’t record table update times in their metadata; use column freshness instead.
Column freshness: Tracks the latest value in a datetime column. An event timestamp can reveal that recent business activity is missing even when a load timestamp has changed.
Custom SQL monitors: Evaluate a metric returned by a query. For example, a query could count expected campaign-day records missing from an ad spend table. Grouped results can be evaluated separately so that an update in one region does not conceal a problem in another.
Source to target monitors: Compare the same metric on a source and a destination—for example, row counts or freshness—and alert when they diverge.
The appropriate signal depends on the requirement. A recently modified table may still contain only older records, while the latest event timestamp may look current even when part of a batch is missing. Combining freshness with row counts or a business-specific completeness check helps teams detect these different failures.
Teams can configure fixed thresholds for agreed freshness limits or use anomaly detection to identify departures from historical behavior. The anomaly model accounts for supported seasonal patterns and trends, and teams can annotate observations to refine the model’s predictions.
When an alert fires, lineage helps responders trace upstream dependencies and identify downstream consumers. A delayed table can be examined in relation to the jobs that populate it and the dashboards or applications that depend on it.
Jobs Monitoring provides execution details for investigating failed or slow jobs. For supported technologies, responders can examine errors, logs, and infrastructure metrics to understand whether a delay comes from the job’s processing or its underlying resources.
Alerts can reach the responsible teams through integrations such as Slack and Microsoft Teams. Together, the freshness measurement, dependency information, and execution details help responders determine what is missing, where to investigate, and who needs an update.
Example of a data freshness SLA
For example, a marketing analytics team syncs campaign spend from the Google Ads API into marketing.ad_spend_daily. The table has one row per campaign_id and report_date, plus a _synced_at timestamp. The data supports a 9 a.m. ET budget review, so the previous day’s expected records must arrive by 8 a.m. ET.
The connector re-syncs the last three days to capture revisions to previously reported figures. This means _synced_at can change even when yesterday’s records are missing. The freshness check therefore uses report_date to verify that records for the expected day have arrived, with a separate check for missing campaign records.
The expected records need to reflect the API query and the connector’s handling of zero activity. Google Ads can omit rows from segmented reports when all selected metrics are zero, so an active campaign does not necessarily produce a row for every day.
| SLA term | Requirement for ad_spend_daily |
|---|---|
| Consumer | 9am ET budget reviews |
| Freshness requirement | Yesterday’s rows for every campaign expected under the source reporting rules, using the ad account’s time zone, ET |
| Deadline | Data available by 8am ET |
| Measurement | Check report_date and campaign_id against the expected date and expected campaign-day records |
| Warning | A failed check at 7am ET notifies analytics engineering |
| Breach response | A failed check at 8am ET notifies the on-call rotation and the review owner |
| Objective | Requirement met on at least 26 of 30 days |
The 8 a.m. deadline determines whether a particular update is late. The 26-of-30-day objective describes how consistently the team meets that deadline across the reporting period. It allows four missed days, so the budget-review owner and data team need to agree that the target reflects the impact of those misses.
Row counts can provide an additional warning. In this example, a count below 90% of the trailing seven-day average prompts an investigation into a possible partial load. That comparison needs to account for normal changes in activity, such as campaigns starting, ending, or pausing. It cannot establish which campaign records are missing, so the check against expected campaign-day records remains necessary.
Maintaining data freshness
Freshness requirements are useful when they reflect the decisions data supports and the information those decisions need. Checking the right timestamps, confirming expected records, and assigning responsibility for delayed updates help teams maintain that connection as pipelines change.
For guidance on configuring freshness checks and notifications, see our documentation on Datadog Data Observability monitors.
FAQs
What is data refreshing?
Data refreshing is the process of updating a dataset from its source. Teams may replace the full dataset or load only new and changed records.
Can data be fresh but inaccurate?
Yes. A table can receive updates every five minutes and still contain amounts calculated with an incorrect exchange rate. Freshness checks alone would not detect that error, so teams also need checks on the data’s accuracy.
Does historical data need frequent updates?
It depends. A complete dataset for a closed reporting period may need updates only when corrections or late records arrive. Its age alone does not make it stale. The requirement depends on whether the dataset contains the information needed for its intended use.
How do dbt freshness checks compare with warehouse monitoring?
dbt freshness checks evaluate data against configured freshness requirements. The dbt source freshness command checks declared sources, while dbt freshness in dbt v2 also supports model freshness checks.
Warehouse monitoring can cover datasets outside a dbt project and combine freshness with other data quality signals. Both approaches can run on independent schedules. The decision depends on which datasets need coverage and how the team wants to detect and investigate missed updates.