What are data anomalies?
A data anomaly is a value, pattern, structure, or measurement that deviates significantly from what a dataset normally shows. It’s the unusual spike in a consistently stable metric, the sudden drop in daily active users, or the unexpected null values appearing in a critical field. Data anomalies signal potential issues that warrant investigation.
In data observability, teams investigate unexpected changes to identify their causes and understand which downstream dashboards and applications may be affected. A drop in recorded orders, for example, could reflect a failed data load or a real decline in demand. This article explains the main types and causes of data anomalies, provides examples from data warehouses, and distinguishes them from outliers, errors, and database design anomalies.
How do data anomalies differ from outliers and errors?
Anomalies and outliers are not necessarily errors. The terms “anomaly” and “outlier” are sometimes used interchangeably.
Outliers are extreme values relative to the rest of a dataset; they may still be valid data points.
Errors are incorrect values resulting from system failures, bugs, or human mistakes.
Anomalies are unexpected values, patterns, or changes in a dataset that can reflect valid events or data errors.
An incorrect value can still fall within an expected range, so an error may not produce a statistical anomaly. For example, a large ticket order from a corporate buyer may be a valid outlier. A week of gradually declining orders may be anomalous even when each day’s count looks plausible on its own. Duplicate orders introduced by a replayed feed are errors that may also create an anomalous spike in volume.
These categories can overlap. Investigation helps teams determine whether unusual data reflects a real event or a problem that needs correction.
Why do data anomalies matter?
Data anomalies caused by incorrect or incomplete data can lead to poor decisions, disrupt downstream applications, and undermine trust in reporting. Other anomalies can reveal real changes in business activity that teams may need to act on.
Misleading decisions: Missing transactions can understate revenue, while duplicate records can inflate it.
Disrupted downstream systems: An unexpected column rename can break a transformation or prevent a dashboard from refreshing.
Additional operational work: Data teams spend time investigating discrepancies, correcting records, and checking affected datasets instead of developing new capabilities.
Reduced trust: Repeated discrepancies can cause teams to lose confidence in reports and stop using the data.
A sustained increase in ticket demand, for example, may inform staffing or capacity decisions. Understanding the cause helps teams determine whether a change requires a data fix, a business response, or further investigation.
What are the types of data anomalies?
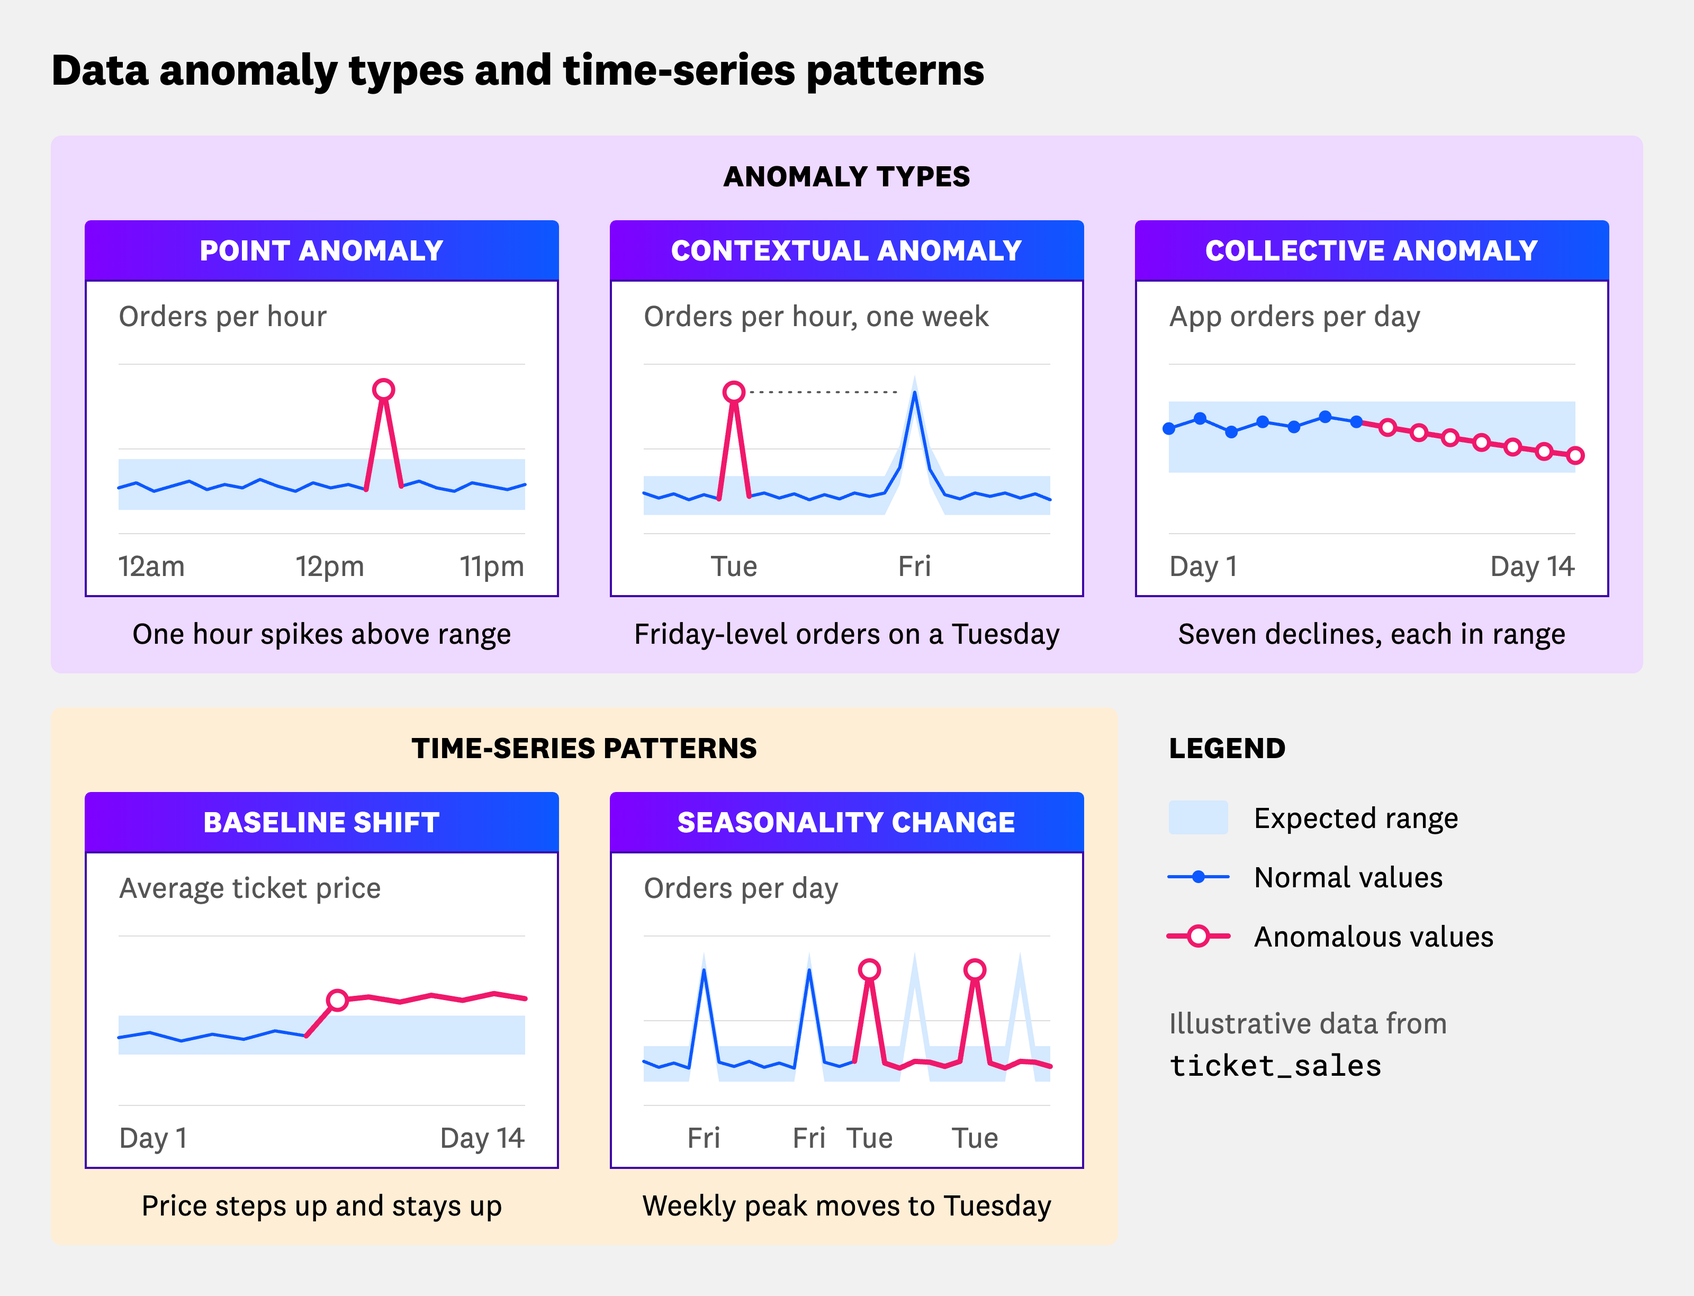
The three classic types of data anomalies are point, contextual, and collective anomalies. Time-series anomalies can also appear as trend shifts, baseline shifts, or changes in seasonality. These patterns are always contextual or collective anomalies, not point anomalies.
Trend, baseline, and seasonal changes are anomalous when they depart from what is expected for the relevant context.
Point anomalies
Point anomalies are single data points that deviate sharply from the expected pattern. In a time series, they can appear as sudden spikes or dips. They can reflect one-off events or errors, such as a rare transaction or a pipeline issue.
For example, an ETL job normally loads about 100,000 rows daily but ingests 500,000 on one day because the same batch is loaded five times. That one-day surge is a point anomaly.
Contextual anomalies
Contextual anomalies are data points that are unusual in a specific context, such as time of day, day of week, or season, even if they might be normal in a broader sense. Context provides the baseline expectation, such as comparing this Monday’s value with typical Mondays.
For example, a 30% drop in website traffic might be expected on a major holiday. The same drop on a normal Tuesday could be a contextual anomaly.
Collective anomalies
Collective anomalies are patterns where a group of data points is anomalous together, even if each point looks normal in isolation. They can reveal a sustained change that would be missed by examining only individual points.
For example, a data pipeline delivers about 5% fewer records each day for a week, with each day’s count remaining within its usual range. Taken together, the persistent decline forms a collective anomaly that warrants investigation.
Trend and baseline shifts
A baseline shift occurs when values move to a different level and remain there. A trend shift changes the direction or rate of increase or decrease. Either can follow a feature launch, a policy change, or a pipeline update.
For example, a mobile app averaging about 50,000 daily users jumps to about 70,000 after a marketing campaign and remains near that level. This is a baseline shift that may reflect valid business growth. If usage instead begins increasing at a faster rate over time, that represents a trend shift.
Seasonality changes
Seasonality changes occur when a repeating daily, weekly, or annual pattern changes unexpectedly.
For example, a streaming platform typically sees a surge in traffic every Saturday night, but its recurring peak shifts to midweek. The regular Saturday peak is expected. The unexpected change in when that peak occurs is what warrants investigation.
What are examples of data anomalies in a data warehouse?
Common data anomalies in a warehouse table include unexpected row counts, stale data, shifted value distributions, schema changes, and spikes in null values. These signals are measurements about the data, though not the data itself. The anomaly types and time-series patterns above describe how that change appears.
Consider a hypothetical ticketing platform’s ticketing.analytics.ticket_sales table, with one row per ticket order. The examples below show how different anomalies can appear in the same table.
| Classification | Type, pattern, or signal | Example in ticket_sales | What makes it unexpected |
|---|---|---|---|
| Anomaly type | Point | A replayed payment webhook doubles one hour’s rows | One hourly count is far above its expected range |
| Anomaly type | Contextual | 4,000 orders at 3:00am on a Tuesday, a level normally seen during a Friday sale | The count is unusual for that hour and weekday |
| Anomaly type | Collective | Orders where channel = 'app' fall 3% a day for a week | Individual daily counts look plausible, but the sustained decline is unusual |
| Time-series pattern | Baseline shift | Average ticket_price steps up 12% after dynamic pricing launches | The average moves to a different sustained level |
| Time-series pattern | Seasonality change | The recurring weekly peak moves from Friday to Tuesday | The timing of the weekly pattern changes |
| Warehouse signal | Volume | No new orders arrive for channel = 'box_office' after a venue feed fails | Expected orders are missing from that segment |
| Warehouse signal | Freshness | No updates for six hours during a sale | Updates stop while new orders are expected |
| Warehouse signal | Distribution | ticket_price arrives in cents instead of dollars, and the mean increases by a factor of 100 | Values change scale relative to their history |
| Warehouse signal | Schema | promo_code is renamed to discount_code upstream without corresponding downstream updates | The structure no longer matches what downstream queries expect |
| Warehouse signal | Null rate | The percentage of null values in buyer_country rises from 2% to 35% | Missing values become much more common |
These classifications can overlap. The replayed webhook produces a point anomaly in a volume signal. The pricing launch produces a baseline shift in the price distribution that may reflect valid business activity. Unexpected structural changes, such as the renamed column, are commonly described as schema drift. A normal total row count doesn’t establish that all expected data arrived.
What causes data anomalies?
Data anomalies can result from human error, system malfunctions, integration or transformation issues, duplicate or corrupted records, changes in data collection, or real changes in business activity. A successful pipeline run does not rule out a data problem, since a job can complete while producing incomplete or incorrect data.
Human error can introduce incorrect values, such as recording a $100 transaction as $1,000.
System failures can interrupt data delivery or processing. A crash during an upload, for example, can leave a partial load.
Integration and transformation issues can change how records are interpreted or combined. Interpreting DD/MM/YYYY dates as MM/DD/YYYY can assign records to the wrong dates, while an incorrect join can duplicate or exclude records.
Duplicate or corrupted records can distort counts and values. A replayed feed can inflate row counts, while corruption can alter stored values.
Sampling or measurement changes can alter reported activity without an equivalent change in actual usage. Reducing the share of events collected can lower raw event counts even when usage is unchanged. Biased sampling or faulty instrumentation can also cause recorded data to misrepresent the activity being measured.
Real changes in business activity can produce anomalies. A pricing change can shift transaction values, while a market downturn can reduce order volumes.
An unexpected row count might result from a failed load, duplicate records, or a real change in demand. Data lineage can help teams trace upstream dependencies during investigation.
What are database anomalies?
In database design, anomalies are problems that arise when a table combines facts that should be stored independently. The three types are insertion, update, and deletion anomalies.
Consider a ticket_orders table that stores each ticket order alongside the venue’s name and address. Venue details are stored only in rows containing an order.
An insertion anomaly occurs when a fact cannot be recorded without another fact being present. A new venue cannot be recorded until a ticket order exists for it.
An update anomaly occurs when repeated information is updated inconsistently. A venue’s address changes, but only some order rows containing that address are updated.
A deletion anomaly occurs when deleting one fact unintentionally removes another. Deleting a venue’s last ticket order also removes the only stored record of its address.
Normalization addresses these design problems by separating independently maintained facts into related tables. These database design anomalies concern how facts are stored and maintained, while anomalies in data observability describe unexpected observations or patterns.
How does Datadog Data Observability help teams investigate data anomalies?
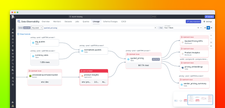
Datadog Data Observability helps teams identify unexpected changes in warehouse data and investigate their causes and downstream impact. It monitors freshness, row counts, and column-level metrics such as nullness, uniqueness, and statistical measures of column values. Its anomaly detection learns expected ranges from historical behavior, accounting for trends and seasonal patterns. Teams can also configure thresholds for fixed business rules.
Table-level and column-level lineage helps teams trace upstream dependencies and identify downstream tables, dashboards, and models that depend on affected data. For example, if buyer_country in the ticket_sales table develops an unexpected increase in null values, teams can use lineage to identify upstream sources and transformations to examine, then assess which downstream assets may be affected.
Teams can combine this dependency context with job-run information, warehouse query history, logs, and infrastructure telemetry to narrow the investigation. This helps connect a change in warehouse data with potential causes at the source or during processing, including cases where a pipeline completed successfully.
For setup guidance, see our documentation on Data Observability monitors.
Investigate unexpected data before treating it as an error
Data anomalies can be caused by pipeline failures, incorrect records, or real changes in business activity. Their significance depends on the expected pattern and the context in which they occur. Investigating the cause and downstream impact helps teams determine whether a change requires correction or represents valid activity.
FAQs
What is an anomaly in SQL?
An “anomaly in SQL” can refer to two different concepts. In database design, insertion, update, and deletion anomalies arise from how tables store related facts. In analytics, SQL can help identify unexpected values or patterns, such as an unusually low daily row count. The surrounding context determines which meaning applies.
How many anomalies are normal in a dataset?
By definition an anomaly is not expected, so there is no normal number of anomalies for a dataset to have. The number flagged depends on the domain, expected behavior, and detection method. A sudden increase in flagged observations may reflect a real business change, a data problem, or a baseline that needs review. Flagged observations should be investigated before being treated as data errors.
Should anomalies be removed from a dataset?
Anomalies should not be removed automatically. Some represent valid events, such as unusually high ticket demand, and removing them can distort analysis. Teams should investigate first, correct confirmed errors where possible, and document any exclusions or transformations. Flagging records can preserve the original data while allowing analysts to decide how to handle them.