What is application performance management?
Application performance management is the collection of tools and processes that enable IT organizations to ensure the availability of their software applications and meet customer expectations. Monitoring data is an essential part of application performance management, as it gives teams the insight they need to identify areas in need of optimization and prioritize tasks effectively. In this article, we’ll discuss why application performance management is important, how it can increase your visibility into dynamic and distributed systems, and what to consider when choosing an application performance management solution.
Why is application performance management important?
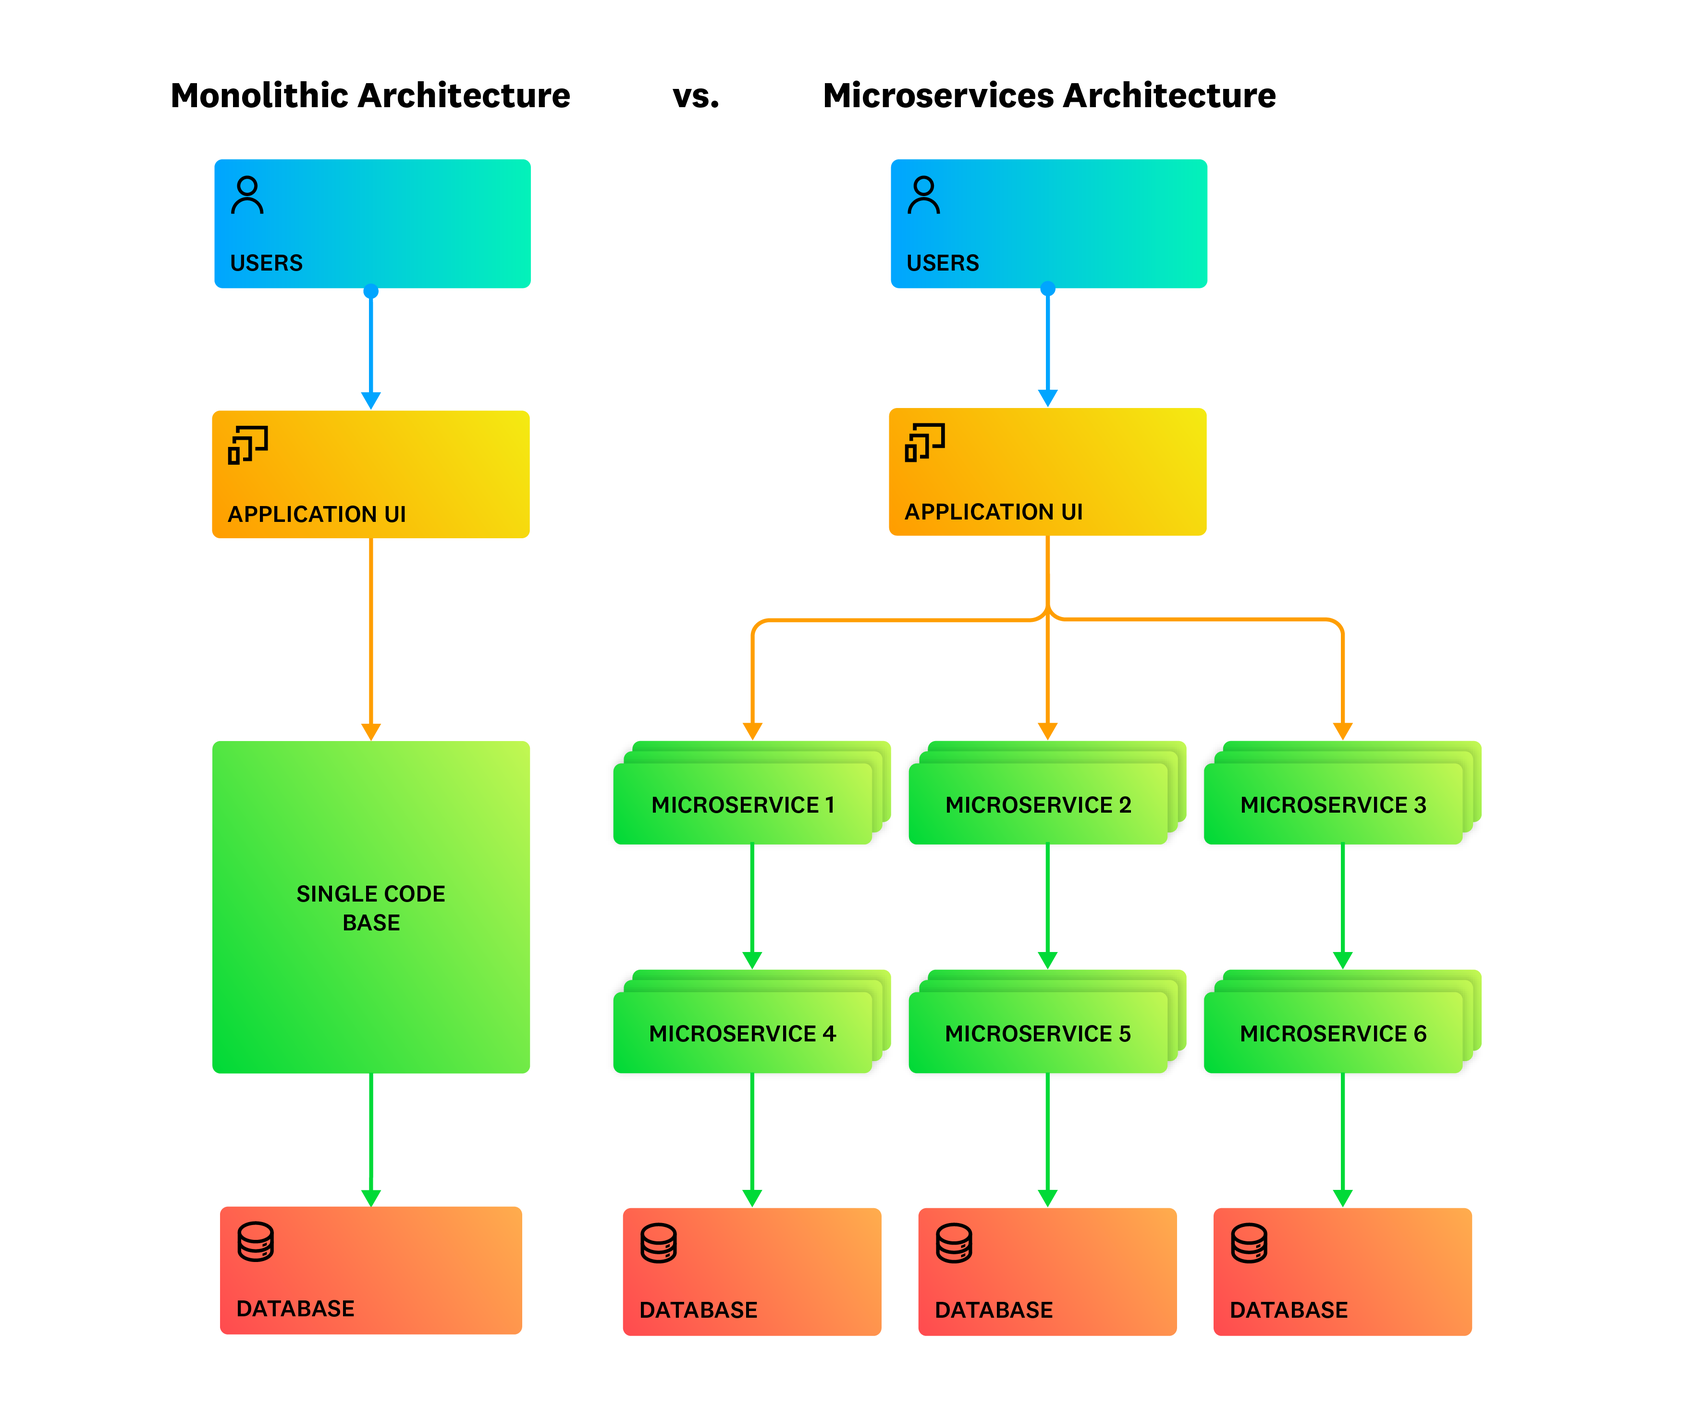
More and more systems architects are choosing to build and deploy their applications as a collection of microservices, rather than as single monoliths. These microservices are typically run on distributed infrastructure components, such as VMs, containers, or serverless functions. This design paradigm allows for each microservice to be scaled independently of one another, which can improve the application’s availability, durability, and efficiency.
While application performance management is necessary for both monolithic and microservice-based architectures, the latter presents a new set of challenges. Without full visibility into every layer of your distributed applications and infrastructure, it can be extremely difficult to detect and resolve critical performance issues. This, in turn, can negatively impact user experience and lead to lost revenue. As such, IT organizations need to leverage an array of monitoring tools in order to increase their system’s observability and effectively manage its performance.
How does application performance management work?
An effective application performance management strategy includes a variety of tools that enable teams to monitor the performance, availability, and user experience of their applications. These tools provide visibility at the user session, service, request, and code levels, and perform a variety of functions, including:
- Distributed tracing
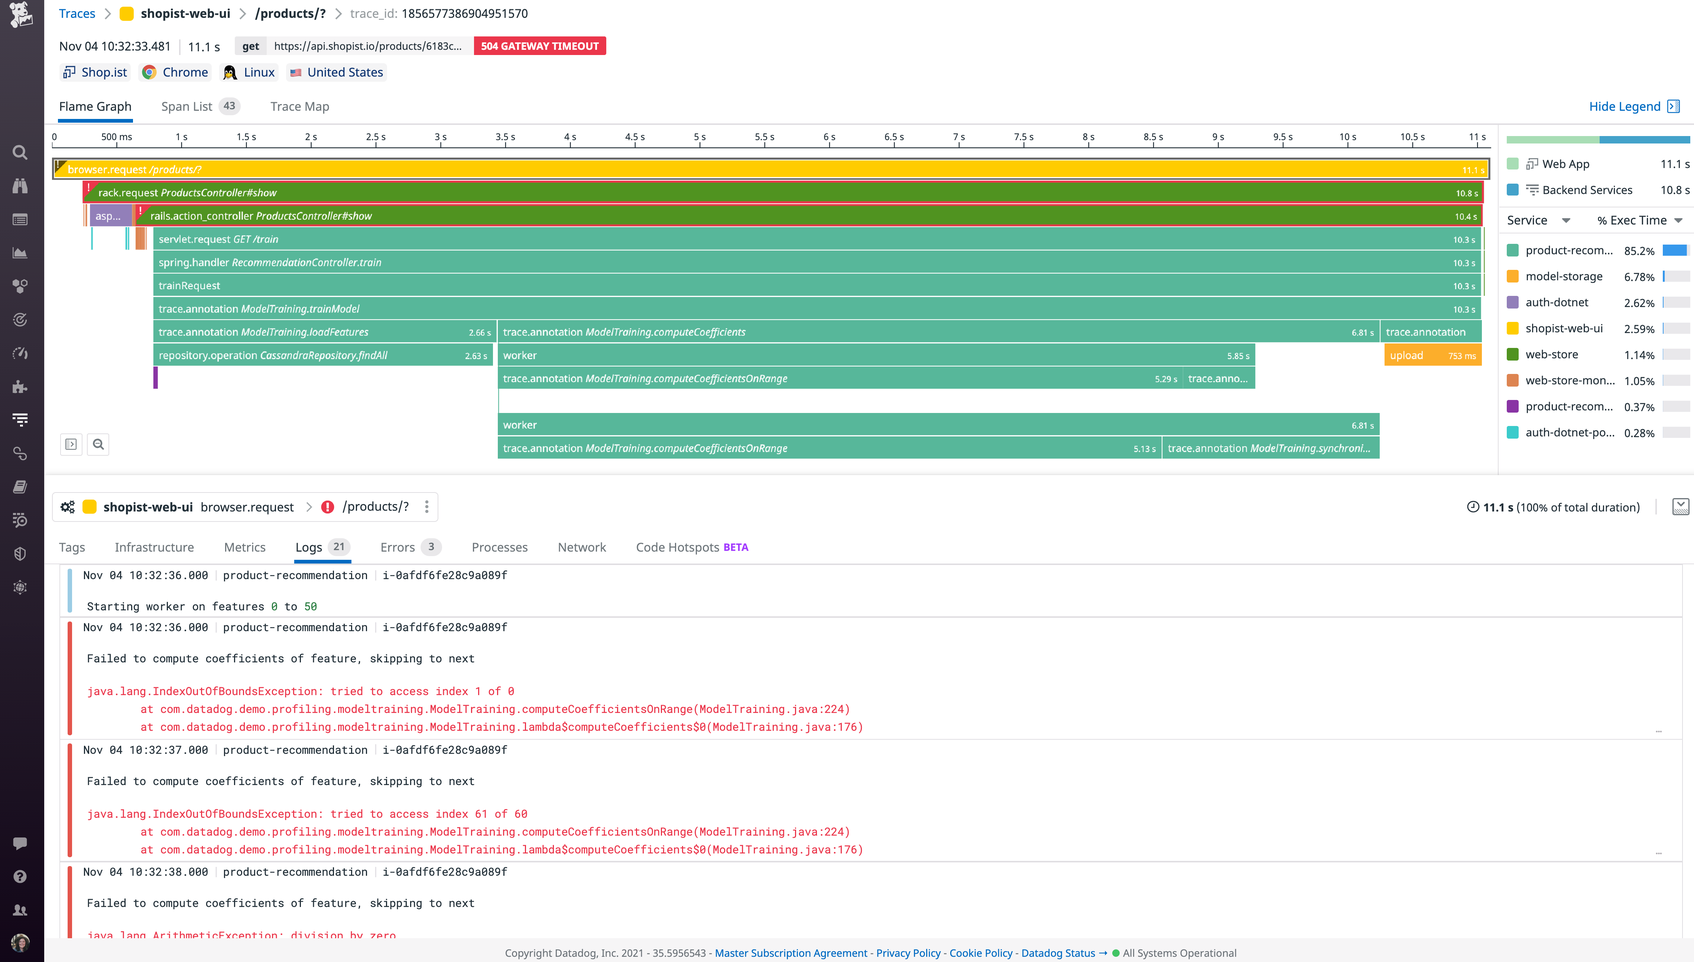
End-to-end distributed tracing allows teams to track requests as they flow from fronted devices to backend services. It also enables developers to monitor per-request dependencies, detect bottlenecks, and pinpoint specific errors. Some tools support auto-instrumentation for all common programming languages, as well as OpenTelemetry standards.
- Service inventorying
A service inventory provides high-level visibility into the health metrics, dependencies, deployments, and monitors of all services in a given application—and allows you to search and filter specific services and their dependencies. It also typically includes service maps, which help developers visualize the topology of applications in order to monitor service health in context.
- Code profiling
Code profiling is a way to capture snapshots of code performance in order to locate the most time- and resource-intensive methods in an application. Some tools expose a variety of profile types, such as wall time, CPU, I/O, lock, and memory.
- Error tracking
Error tracking groups related errors into a manageable set of issues, which provides more context, facilitates smarter troubleshooting, and supports actionable alerting. Some error tracking tools provide visibility into the source code, as well as the state of local variables at the time of the error.
- Database monitoring
Database monitoring provides deep visibility into query performance metrics, explain plans, and host-level metrics, which helps developers determine whether issues are caused by inefficient queries, suboptimal database design, or resource saturation.
- Digital experience monitoring (DEM)
DEM suites typically include Real User Monitoring (RUM) and synthetic testing, which both play an important role in detecting and reducing user-facing issues. RUM not only allows teams to collect and alert on real-time metrics such as load times, error rates, and Core Web Vitals, but also captures video recordings of user sessions to help teams better understand the specific conditions around frontend problems. Synthetic testing, meanwhile, simulates user traffic in order to help teams proactively detect issues with key endpoints and user journeys.
When used together, these tools provide teams with context-rich insights into how their applications are performing, so they can make data-driven management decisions, ensure the consistent availability of every application component, and deliver a strong user experience.
End-to-end application monitoring with Datadog
What are the main benefits of application performance management?
An integrated application performance management strategy can transform the way your team operates, regardless of the scale or complexity of your system. It can also help you achieve long-term goals, whether that means migrating to the cloud or adopting a DevOps culture. Some specific benefits of application performance management include:
- Reduced MTTD and MTTR
If an application is experiencing elevated latency, engineers can analyze trace and code profiling data to quickly isolate and remediate bottlenecks. They can also use error tracking to easily understand the scope and severity of errors—and draw connections between them.
- Better collaboration
End-to-end tracing enables frontend and backend teams to leverage the same data when troubleshooting user-facing errors and optimizing their applications.
- Reduced risk during migrations
Teams can leverage a service inventory and distributed tracing to ensure that crucial transitions, such as cloud migrations or modernizations, do not introduce regressions.
- Improved user experience
The tools involved in application performance management offer different vantage points on how an application is serving its end users, which enables developers to make frontend and backend optimizations accordingly.
- Increased agility
Teams can use synthetic testing to proactively detect user-facing issues and prevent breaking changes from reaching production. They can also leverage deployment tracking tools to ensure code changes have not introduced performance regressions. This enables them to sustain a rapid development pace and bring more features to market.
While the benefits of application performance management are numerous, there are some challenges, as well:
- Tool sprawl
An effective application performance management solution requires the use of several tools, but this can lead to siloed data, conflicting sources of truth, and context switching that slows down the troubleshooting process.
- Maintenance
There are many open source tools you can use to manage and monitor your application’s performance. These tools offer flexibility and control, but they also take a lot of time to implement and maintain—and can lead to unexpected infrastructure and compute costs as your environment scales.
- Scalability
Modern environments scale dynamically to meet demand, which means that your application performance management solution must be able to accomodate ephemeral components, such as containers and serverless functions.
Choosing an application performance management solution
The various challenges of application performance management, discussed above, make it important to choose a low-maintenance, unified solution that can scale to support both your long-term and short-term goals. Consider selecting one that includes the following features:
- End-to-end distributed tracing with no sampling
While some tracing tools make sample decisions at the beginning of a request’s lifecycle (i.e., head-based sampling), the most effective solutions enable you to ingest 100 percent of your traces by default. Traces should also capture and visualize the entire request—from frontend device to backend services—in order to ensure that teams have all the data they need to troubleshoot.
- Automatic service mapping
The dynamic, ephemeral nature of modern applications makes it difficult to keep track of which services are running and where. A strong service mapping tool will utilize application traces to construct a live view of service dependencies across your entire environment, which developers can use to investigate failures and identify root causes of performance issues.
- Low-overhead code profiling
Some code profilers introduce considerable overhead, which restricts their usage and ultimately results in limited code-level visibility. A strong code profiling tool can run continuously in production without affecting application performance—and provide both request- and service-level details.
- Machine learning-powered alerts and insights
Machine learning-based tools allow teams to automatically identify causal relationships between performance issues and isolate their root cause. This hands-free approach is particularly useful in large-scale, dynamic systems, and it can significantly reduce an organization’s MTTR while saving them both time and money.
Datadog’s unified platform, which includes all of these features, provides a holistic application performance management solution for organizations operating at any scale. Distributed Tracing enables teams to search 100 percent of their end-to-end traces in real time over a 15-minute window—and create custom retention rules to keep the ones that matter most. Traces are automatically linked to full-stack monitoring data, including code profiles from our always-on Continuous Profiler, so users can follow service-level bottlenecks down to individual lines of code. Request Flow Map enables you to view live requests in context so you can follow application issues to the source, while Watchdog uses machine learning to automatically surface performance anomalies and identify their root cause.