
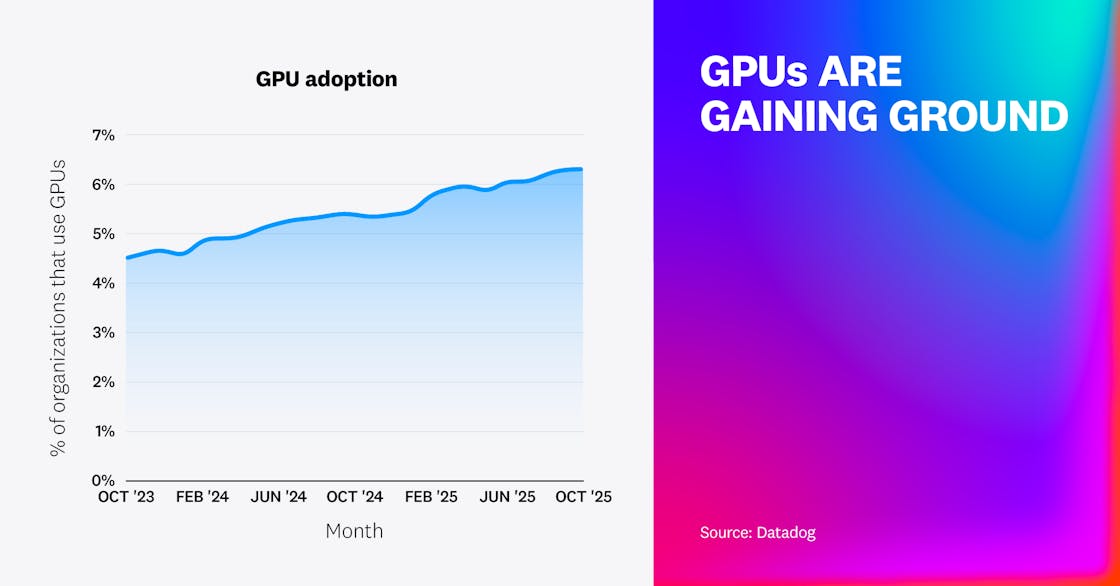
GPU adoption has increased to support growing AI and data-intensive workloads
As AI workloads such as training, inference, and data processing become more common, organizations are beginning to adopt GPU-powered instances to efficiently support those activities. Our data shows a steady rise in the uptake of GPUs over the last 2 years.
Adoption of GPUs is still limited to a small number of organizations running large-scale AI, data processing, and research computing workloads. But those early adopters are driving rapid growth, consuming three times as many instance hours as they did 2 years ago. They still account for less than 3% of the instance hours consumed by CPUs and other traditional compute, but use of GPUs is growing at a much faster rate.
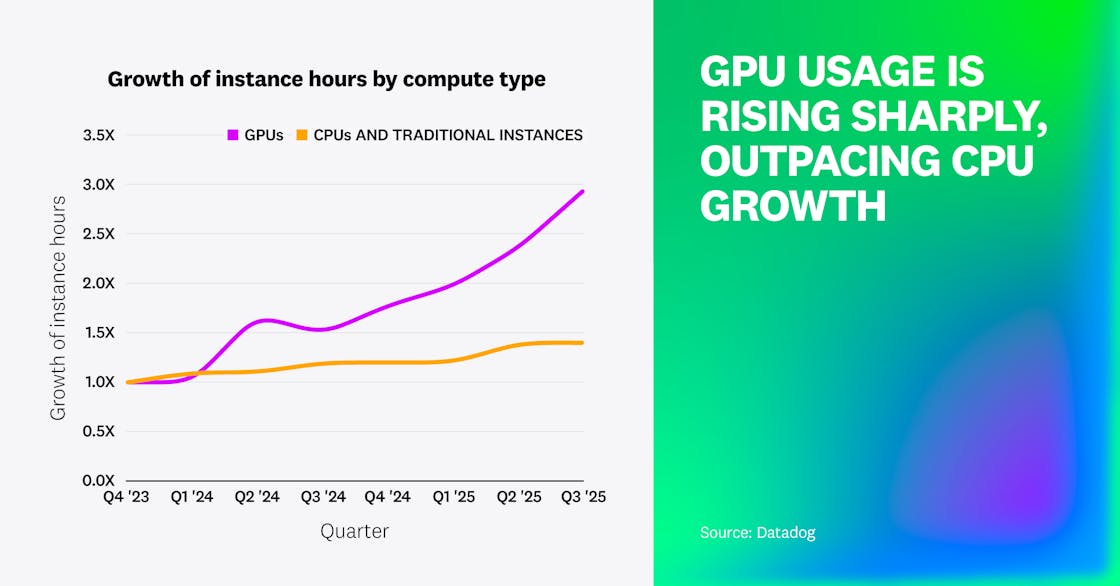
We expect GPU adoption to expand with continued growth of AI and drive further increases in instance hours consumed. Early in this adoption curve, we’re seeing inference servers gain traction, with Triton, vLLM, and Ollama leading the way. However, the pace of future growth will depend on several factors, including chip supply, advances in workload efficiency, energy availability, and the ability of organizations to manage rising infrastructure costs.
AI joins the most popular workload categories for containers
Building on previous research into the most popular categories of containerized workloads, we saw some familiar categories this year as well as some new ones. The databases category remains in front, with Redis again the most widely used and its fork, Valkey, rising fast. As a category, web and app servers are nearly as prevalent as databases.
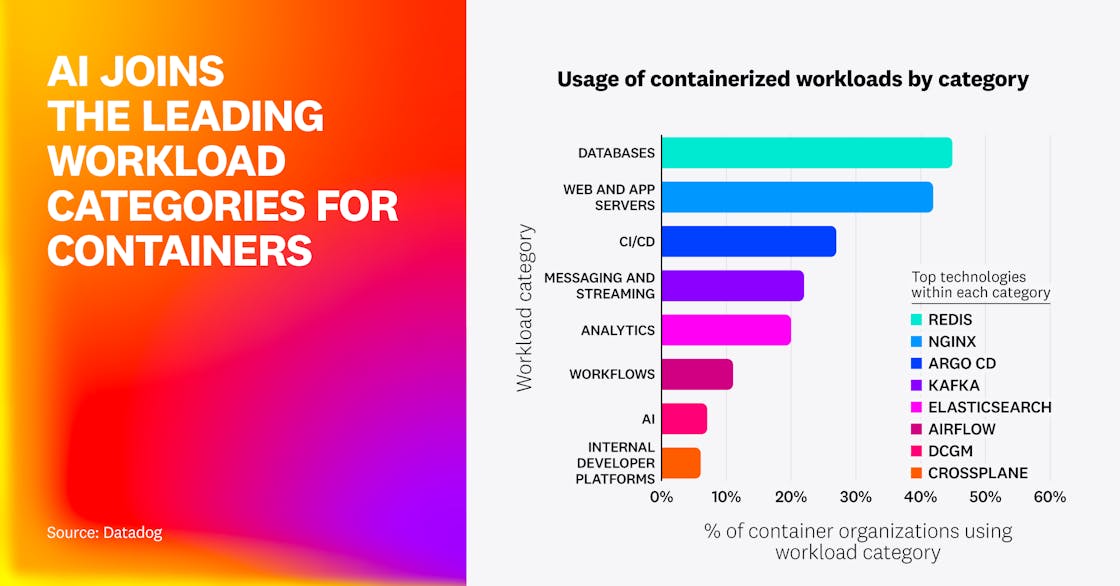
We also saw entrants in a new workflows category, led by Airflow. Additionally, AI has emerged as a notable new workload category, though it remains far less common than the long-standing leaders. This category is led by NVIDIA Data Center GPU Manager (DCGM) and includes inference servers such as vLLM and vector databases, including Qdrant. AI workloads still represent a small share compared to traditional compute and application use cases, but early GPU adoption suggests that they’re here to stay and may soon displace some of today’s top categories.
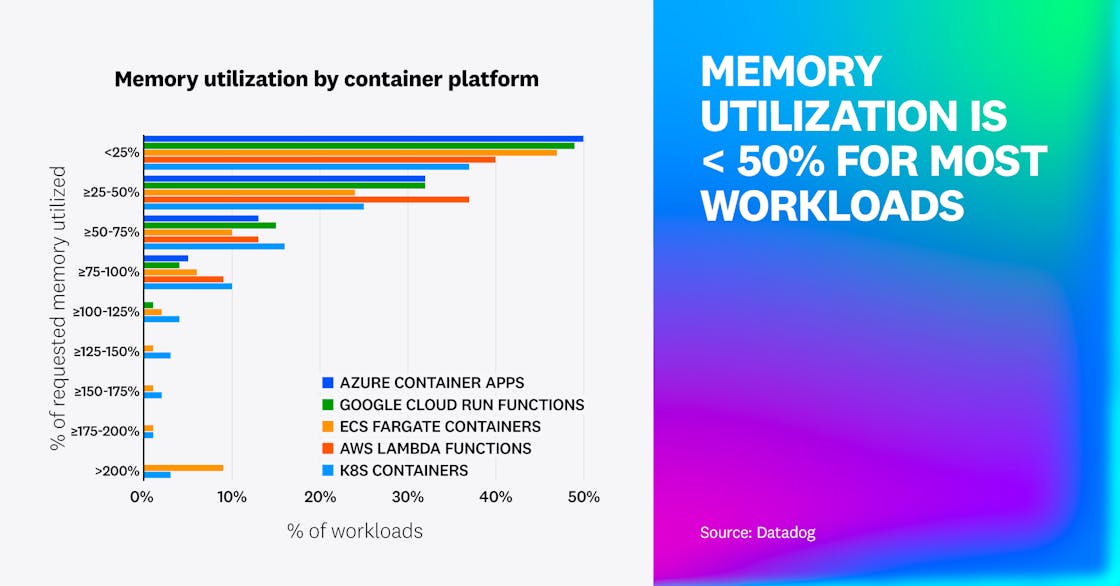
Most workloads use less than half of their requested resources
Across Azure Container Apps, Google Cloud Run, Amazon ECS Fargate, AWS Lambda, and Kubernetes, most workloads use less than half of their requested memory and less than 25% of their requested CPU. Historically, we’ve observed a pattern of underutilization in Kubernetes environments, and this data shows that it extends to other environments as well.
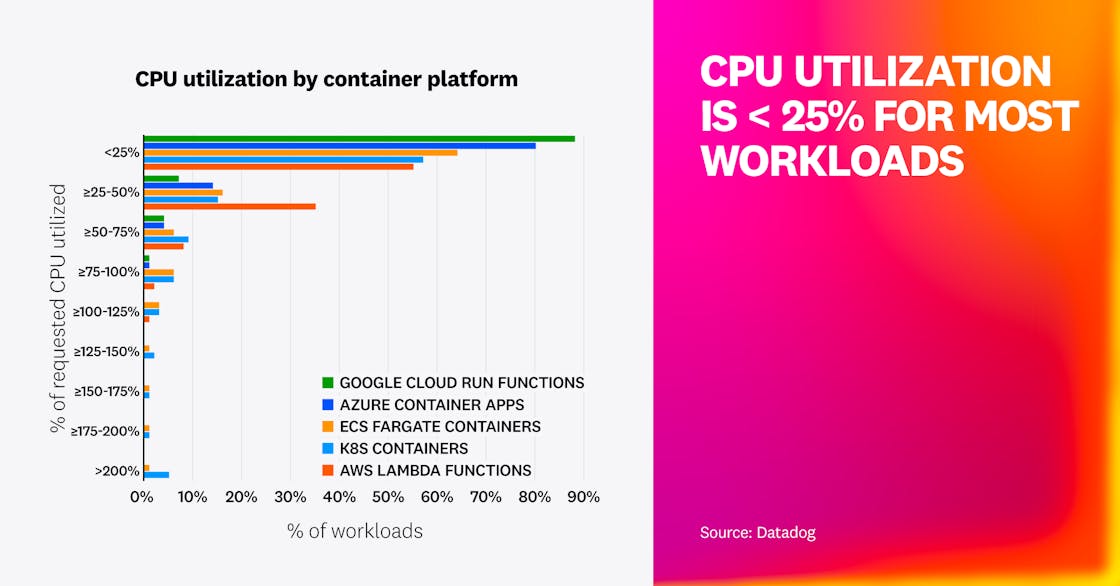
Several factors likely contribute. Many teams intentionally overprovision resources to prioritize stability and manage the risk of throttling or latency during traffic spikes. Platform design can also play a role. For example, in Lambda, CPU scales proportionally with memory, so sizing for one resource may leave the other mostly idle. Similarly, in Fargate, developers must choose from predefined bundles of CPU and memory that may not match workload needs.
Underutilized resources will always be present as organizations continue to fine-tune new services and build in headroom to ensure performance. The ideal amount of unused capacity varies by application, but the data shows that organizations have ample room to lower costs through more efficient use of cloud resources. Teams should monitor high-cost workloads and experiment with different compute models, shifting containerized services to serverless functions or the other way around to improve efficiency. When launching new services, teams should use profiling to reveal how workloads actually consume resources, and then apply that knowledge to make more accurate initial allocations.
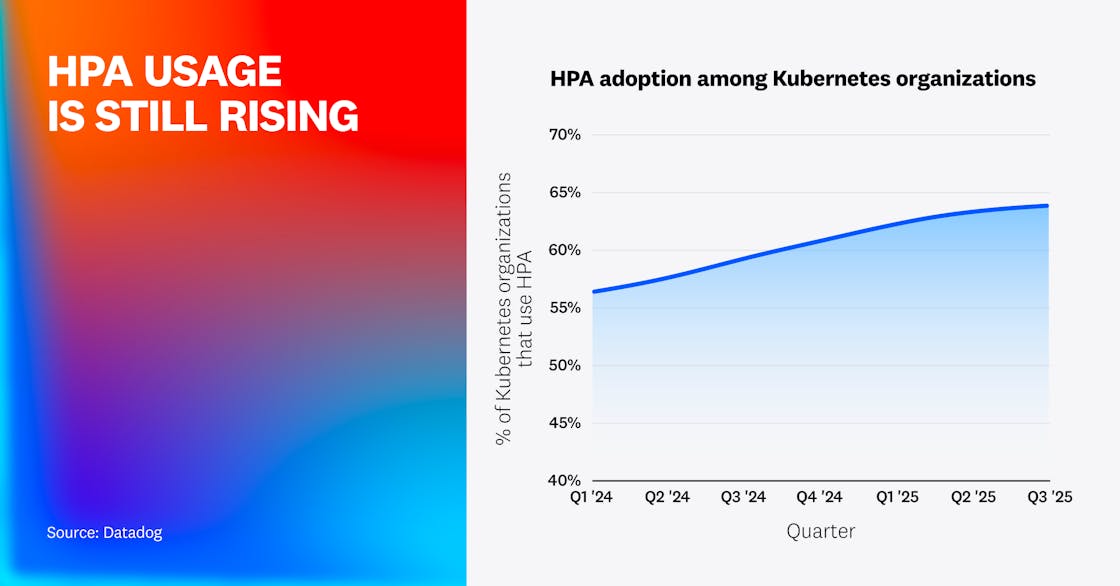
Nearly two-thirds of Kubernetes organizations use HPA
Continuing a trend we noted in 2021 and again in 2023, a growing share of Kubernetes organizations—now over 64%—has adopted Horizontal Pod Autoscaler (HPA). HPA enables administrators to improve the cost and resource efficiency of their clusters by automatically resizing their deployments to meet demand without overprovisioning. The sustained increase in its adoption shows that HPA’s benefits—simplified cluster management and automatic cost optimization—are well established and widely accepted.
We’ve also found that despite HPA’s pervasive adoption, cluster infrastructure is often overprovisioned, leading to idle container resources and wasted cloud spend.
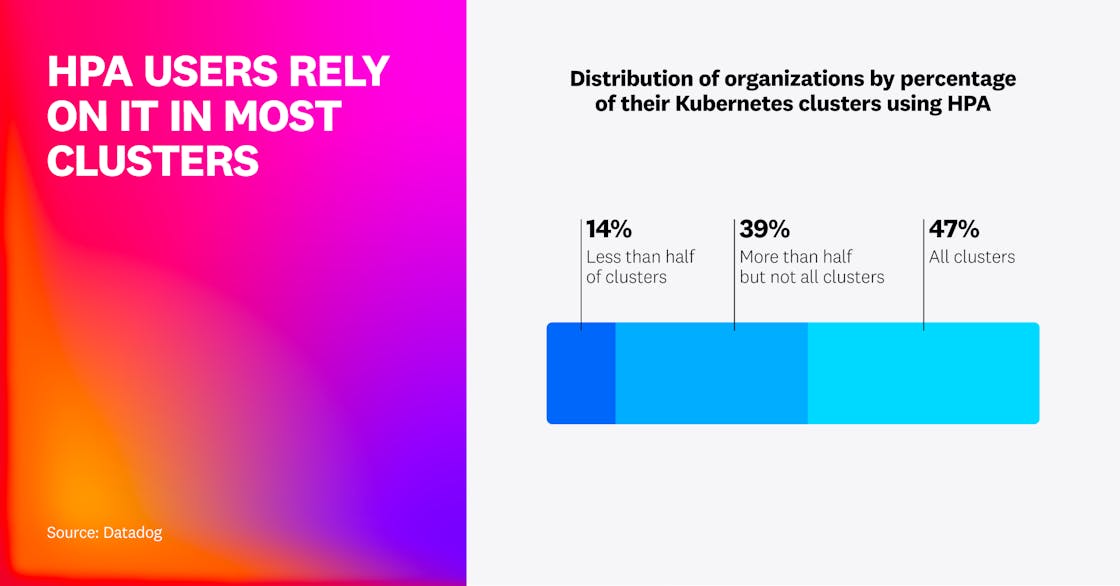
Our data shows not just increasingly broad HPA adoption, but also deep use within organizations. Eighty-six percent of HPA users apply it in most of their clusters, and nearly half use it in every cluster. This suggests that HPA is a foundational part of Kubernetes for most users, not a feature they rely on for only a narrow range of workloads.
While horizontal scaling adoption continues to rise, many clusters that run workloads with volatile traffic don’t yet take advantage of it. We found that 46% of unscaled workloads experienced multiple significant CPU spikes per day, suggesting that they would be good candidates for horizontal scaling. We anticipate that horizontal scaling adoption will continue to grow as organizations seek to handle spikes like these more efficiently and cost-effectively.
Only 20% of HPA-enabled deployments use custom metrics for autoscaling Kubernetes
Of the deployments in our dataset that use HPA, only 20% use custom metrics to scale based on application characteristics such as queue depth or request rate. Four out of five deployments scale based on changes in CPU or memory utilization instead of custom metrics.
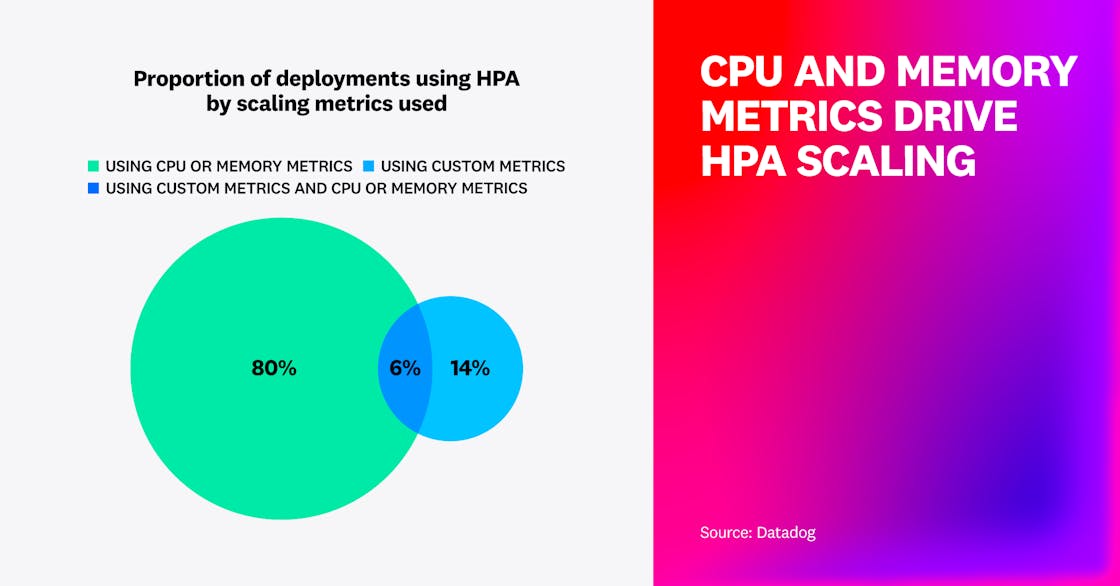
CPU and memory usually provide the most relevant signals for when to add or remove capacity, and most applications scale effectively based on these metrics alone. But for workloads that are not CPU- or memory-bound, scaling based on custom metrics instead is often advantageous. By providing indicators of a workload’s actual behavior, custom metrics enable cluster administrators to configure more precise autoscaling to achieve better performance and cost efficiency.
Karpenter adoption overtakes Cluster Autoscaler
Karpenter has replaced Cluster Autoscaler as the leading tool for autoscaling in Kubernetes. Our research shows that the percentage of nodes provisioned by Karpenter rose by 22% in the last 2 years, while nodes provisioned by the Kubernetes Cluster Autoscaler declined by 17%. The share of nodes using either tool has held steady, and benefits like cost optimization and simplified administration likely contribute to autoscaling’s continued importance.
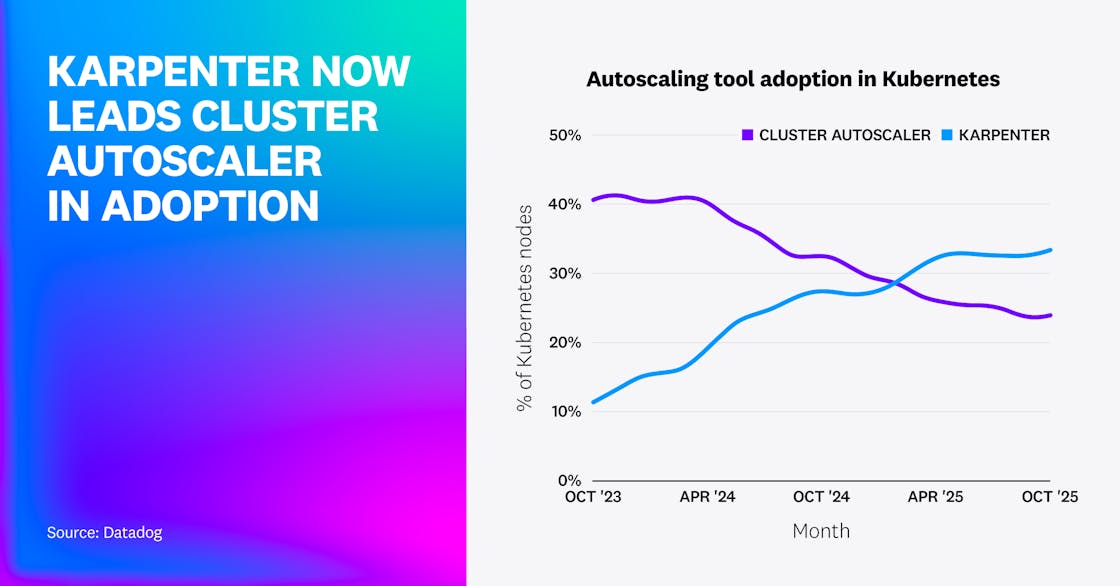
The shifting adoption data suggests that organizations recognize Karpenter’s advantages, including greater flexibility in choosing instance types compared to Cluster Autoscaler. Karpenter was originally developed by AWS, but its presence is growing in Azure and other clouds, giving momentum to its increasing adoption.
Most cloud customers use one or more serverless offerings
Most customers in AWS, Google Cloud, and Azure use at least one serverless compute service. Lambda is AWS’s most popular serverless offering, used by 65% of AWS customers, and Cloud Run shows similar adoption on Google Cloud at 70%. On Azure, 56% of customers use App Service—more than any other serverless compute offering.
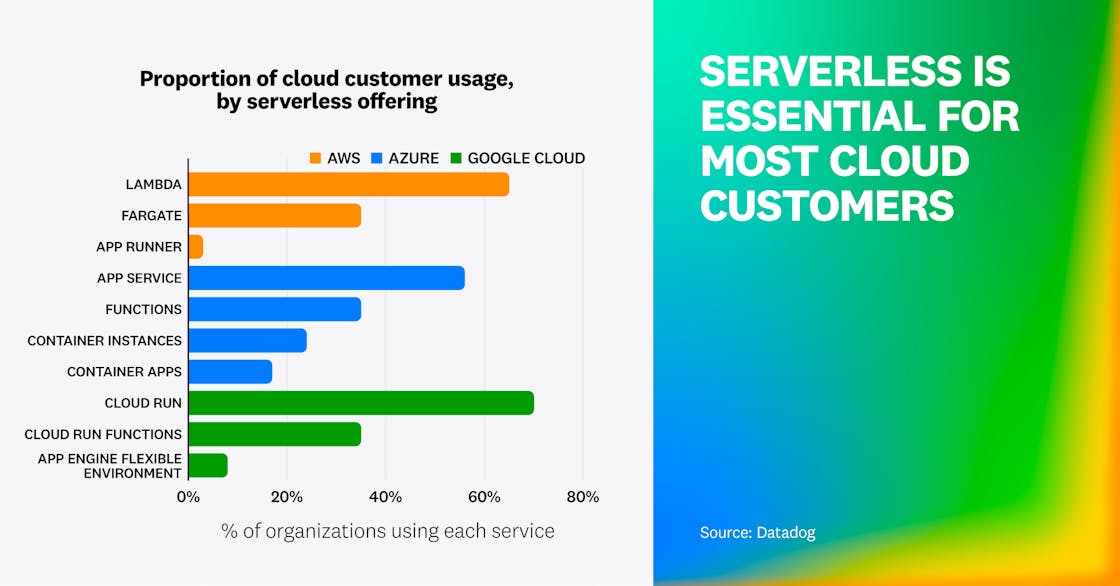
Taken together, this data suggests that serverless is essential for most customers but not tied to a single dominant use case. The leading services excel across different workload types—Lambda for event-driven functions, Cloud Run for containerized services, and App Service for always-on apps. Lacking a single use case, we attribute serverless’s high adoption to its broad advantages—fast and transparent scaling, per-invocation pricing, and operational simplicity.
“Datadog's 2025 State of Containers and Serverless report highlights that serverless has become fundamental to how developers build modern applications in the cloud, driven by the automatic scaling, cost efficiency, and agility offered by services like AWS Lambda. We're excited to see organizations benefit from the serverless operational model as we continue to enhance the developer experience through innovations that make it easier to build emerging or increasingly complex workloads and architectural patterns.”
Principal PM for AWS Serverless Compute
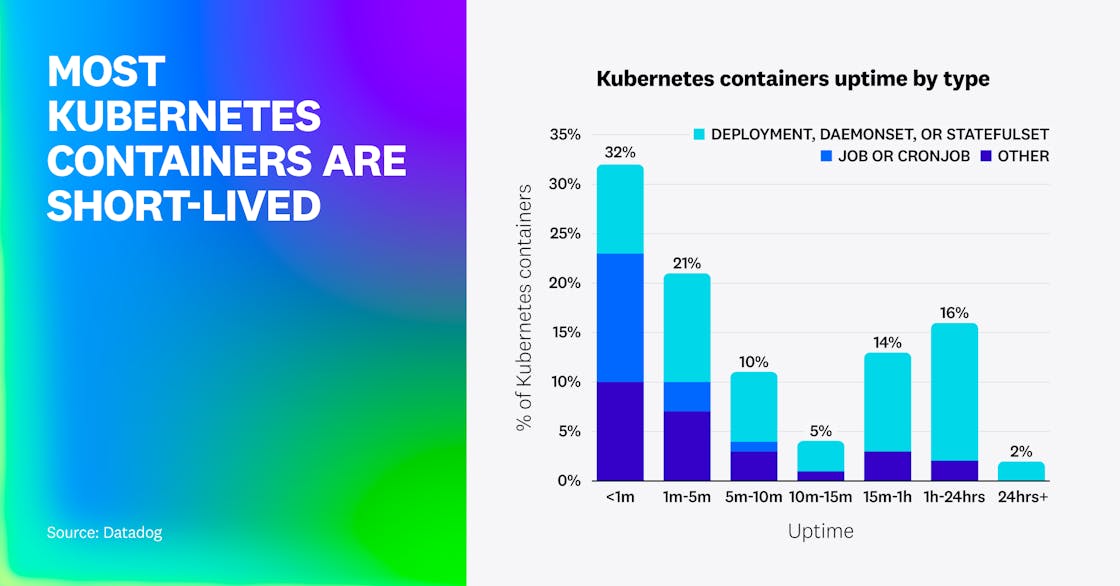
Jobs and CronJobs run short, but Deployments and StatefulSets are long-lived
Most Kubernetes containers are short-lived: Almost two-thirds have an uptime under 10 minutes, and about one-third finish running in under 1 minute. Most short-lived containers are associated with Jobs, CronJobs, and standalone Pods. By contrast, containers running more than 10 minutes are most often part of a Deployment, DaemonSet, or StatefulSet, suggesting that those Kubernetes objects manage primarily long-lived containers.
Short-lived containers are useful for scheduled workflows and one-off operational or development tasks. But their prevalence exposes a gap: Kubernetes’ core autoscaling components can’t effectively scale these workloads. Jobs and CronJobs typically complete before the HPA can adjust replica counts or the Vertical Pod Autoscaler (VPA) can replace containers with new, right-sized ones.
Lacking these autoscaling capabilities, organizations can more efficiently allocate resources for Jobs and CronJobs by:
- Profiling them to determine initial resource needs, then manually applying VPA recommendations to right-size them based on their resource usage history across runs
- Using the Job specification’s
parallelismandcompletionsfields to provide limited horizontal scaling - Using Kubernetes Event-Driven Autoscaler (KEDA) for event-driven horizontal autoscaling based on performance metrics like queue length or pipeline latency
Organizations may also choose to deliberately overprovision resources for these workloads and even isolate them in dedicated clusters. But these approaches sacrifice efficiency in favor of performance and availability. Instead, organizations can migrate these workloads to serverless functions platforms to gain cost efficiency and operational simplicity. By using serverless functions, organizations don’t need to manage infrastructure or scaling configurations, and they keep costs aligned with actual usage by incurring charges only when a function is invoked.
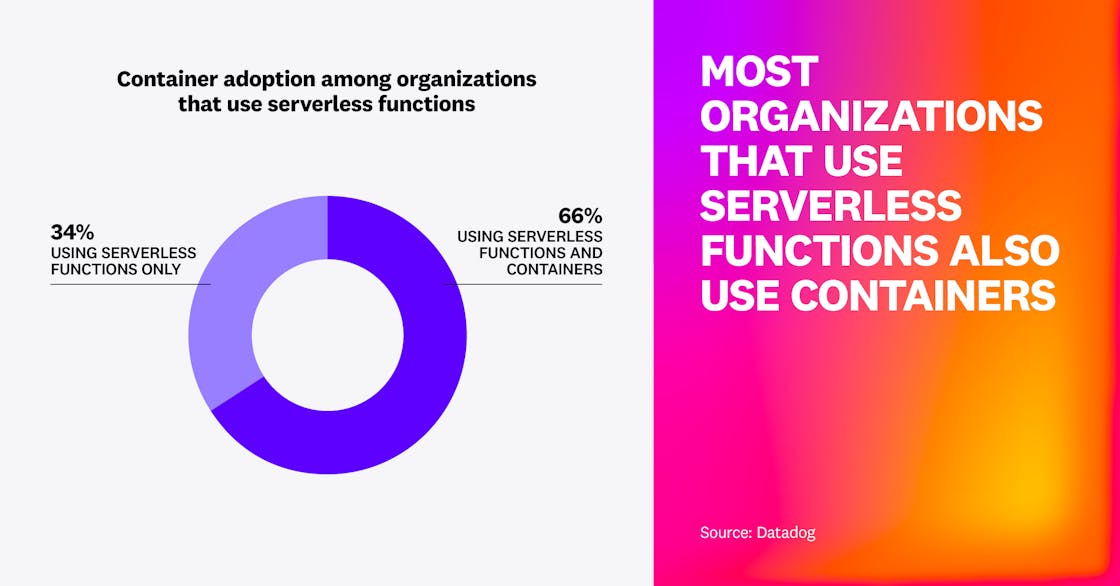
Most organizations that use serverless functions also use containers
We found that 66% of organizations that use serverless functions also use at least one container orchestration service in the same cloud. Serverless functions and containers overlap in capability, and the use of both suggests that organizations selectively choose the technology that best fits each of their workloads. For example, organizations may use serverless functions for spiky workloads and containers for long-running workloads with complex infrastructure.
The combination of serverless functions and containers may also reflect organizations’ shift to modern development practices, which empower teams to choose their preferred tools rather than holding them to a standardized stack.
Arm usage continues to expand across Lambda functions and cloud instances
Our research shows that the share of AWS Lambda functions running on Arm—rather than x86—grew from 9% to 19% over the past 2 years. Arm-based cloud instances also showed a substantial increase, rising from 9% to 15%.
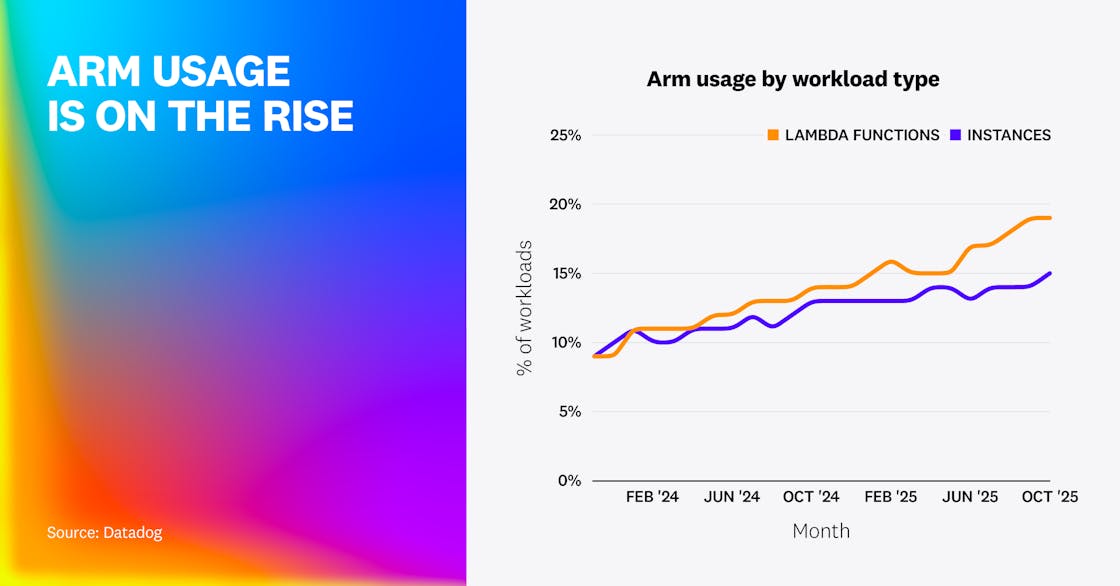
AWS advertises up to 34% better price performance for Lambda functions on Arm, and similar efficiency gains when Arm is used in services such as Amazon EC2, Amazon RDS, and Fargate. These advantages have already helped establish the trend toward Arm adoption for Lambda functions and containerized workloads. Given these efficiency improvements, we expect this momentum to continue as organizations deploy new workloads onto the more cost-efficient architecture.