Ruby Performance Monitoring | Datadog

Ruby Performance Monitoring & Analytics

Analyze, troubleshoot, and monitor Ruby applications with Datadog APM.

Full-stack monitoring for Ruby applications

  • Optimize and monitor Ruby performance to meet service level agreements
  • Identify dependencies with the automatically generated Service Map
  • Troubleshoot Ruby issues at the application, endpoint, and customer-level with App Analytics

Search and analyze Ruby stack traces

  • Quickly debug issues with Ruby tracing that highlights errored requests and functions in the trace view
  • Automatically correlate Ruby stack traces and logs for rapid root cause analysis with TraceID
  • Identify and fix issues before they grow by tracking errors and abnormal behavior with Log Patterns and Analytics

Built-in support for Ruby frameworks and libraries

  • Automatically instrument your applications for popular Ruby frameworks like Rails and Sinatra
  • Identify high latency Ruby requests for databases like MongoDB or Elasticsearch
  • Monitor Ruby applications alongside data from 700+ other turnkey integrations
Datadog programming language and framework support integration tiles

Rapid troubleshooting for Ruby performance issues

Leverage Datadog APM for next-generation Ruby monitoring and analytics.
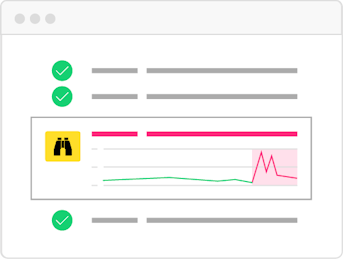
watchdog-apm-illustration.png

Watchdog

Auto-detect Ruby performance problems without manual setup or configuration.
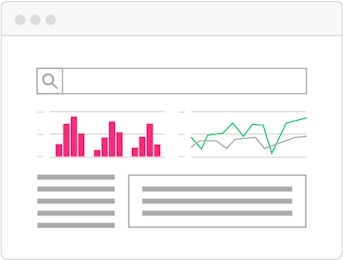
tracesearch-apm-illustrationv2.png

App Analytics

Search, filter, and analyze Ruby stack traces at infinite cardinality.
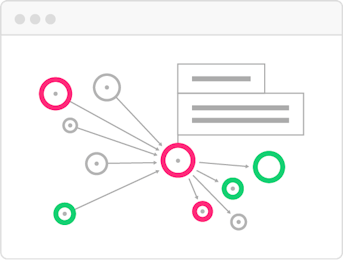
servicemap-apm-illustration.png

Service Map

Map Ruby applications and their supporting architecture in real-time.

多くの企業で愛用され信頼を得ています

Samsung logo Ubisoft logo Deloitte Cloud logo Cybozuinc logo sansan logo Nginx logo Chef logo Nasdaq logo DreamWorks Animation logo Nikon logo Zynga logo Evernote logo Sonos logo Monotaroco logo