
Full Stack Monitoring | Datadog

Full Stack Monitoring

Unify your data in a single full stack monitoring platform with Datadog

As your tech stack grows, you need to be able to get full visibility into the health and performance of each layer of environment at a glance. Datadog full stack monitoring lets you collect and correlate data from more than 1,000 vendor-backed technologies, all in a single pane of glass. Monitor your underlying infrastructure, supporting services, and applications from one unified platform.


Datadogを始める5つのステップ

ステップ1
トライアル登録フォームに入力 わずか30秒で無料でアカウントを作成。クレジットカードは不要
ステップ2
技術スタックに関する基本的な質問に回答 約1分で完了
ステップ3
Datadog エージェントをインストール システムレベルのメトリクスをDatadogプラットフォームに送信
ステップ4
API経由で追加のメトリクスを取得するための認証情報を提供 AWS、Azure、GCPなどのクラウド環境を完全に可視化
ステップ5
すぐに使えるダッシュボードでパフォーマンスを視覚化 環境全体のパフォーマンスをリアルタイムで確認可能

Optimize your systems with end-to-end visibility

Use full stack monitoring from Datadog to troubleshoot performance issues.
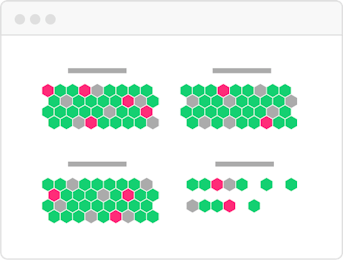
hostmap-infra-illustration.png

Host and Container Maps

Visualize the status of your servers or containers in a single view.
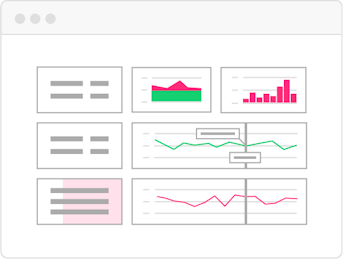
synchronized-dashboards-infra-illustration.png

Synchronized Dashboards

Track incidents across metrics with a common tagging structure.
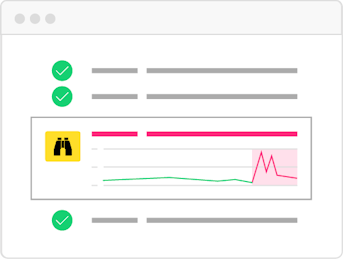
watchdog-apm-illustration.png

Watchdog

Detect performance issues using machine learning.

Datadog プラットフォームは数多くのお客様に選ばれ、信頼されています

Samsung logo
Ubisoft logo
Deloitte Cloud logo
Cybozuinc logo
sansan logo
Nginx logo
Chef logo
Nasdaq logo
DreamWorks Animation logo
Nikon logo
Zynga logo
Evernote logo
Sonos logo
Monotaroco logo