
IIS Logs Monitoring and Analysis | Datadog

Monitoring IIS Logs

Collect, visualize, and alert on key IIS metrics including latency, rejected connections, HTTP status codes, connect counts, slow response times, and more.

With Datadog Log Management, you can monitor and analyze logs from IIS in real time. Collects metrics for active connections, bytes sent and received, request count by HTTP method, and more. Monitor and analyze your IIS logs without any need for active querying, and recieve alerts when there’s an issue with IIS.


Datadogを始める5つのステップ

ステップ1
トライアル登録フォームに入力 わずか30秒で無料でアカウントを作成。クレジットカードは不要
ステップ2
技術スタックに関する基本的な質問に回答 約1分で完了
ステップ3
Datadog エージェントをインストール システムレベルのメトリクスをDatadogプラットフォームに送信
ステップ4
API経由で追加のメトリクスを取得するための認証情報を提供 AWS、Azure、GCPなどのクラウド環境を完全に可視化
ステップ5
すぐに使えるダッシュボードでパフォーマンスを視覚化 環境全体のパフォーマンスをリアルタイムで確認可能

Next-Generation Synthetic Monitoring

Maintain a positive user experience and minimize downtime.
dg/cicd-illustration.png

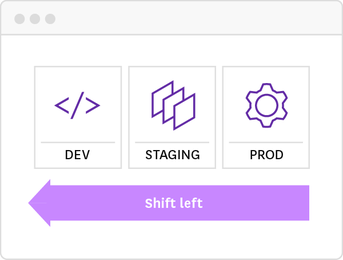
CI/CD testing

Shift test automation practices to the left to catch issues earlier on in the development process.
dg/slos-illustration.png

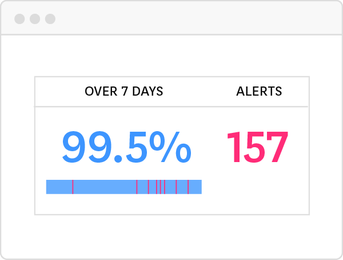
SLO tracking

Real time visibility into your SLOs through drag and drop dashboard widgets.
servicemap-apm-illustration.png

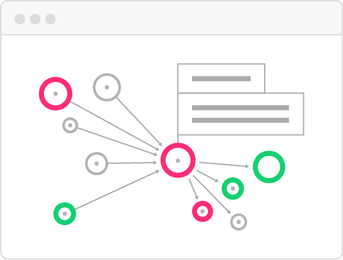
Root cause analysis

Full stack correlation from synthetic tests to metrics, traces, and logs.

IIS Logs Monitoring Resources

Learn about IIS logs and monitoring best practices.

IIS Monitoring Blog Posts

Datadog プラットフォームは数多くのお客様に選ばれ、信頼されています

Samsung logo
Ubisoft logo
Deloitte Cloud logo
Cybozuinc logo
sansan logo
Nginx logo
Chef logo
Nasdaq logo
DreamWorks Animation logo
Nikon logo
Zynga logo
Evernote logo
Sonos logo
Monotaroco logo