Editor’s note: MySQL uses the terms “master” to describe its architecture and certain metric names. Datadog does not use this term. Within this blog post, we will refer to this term as “primary node”, except for the sake of clarity in instances where we must reference a specific metric name.
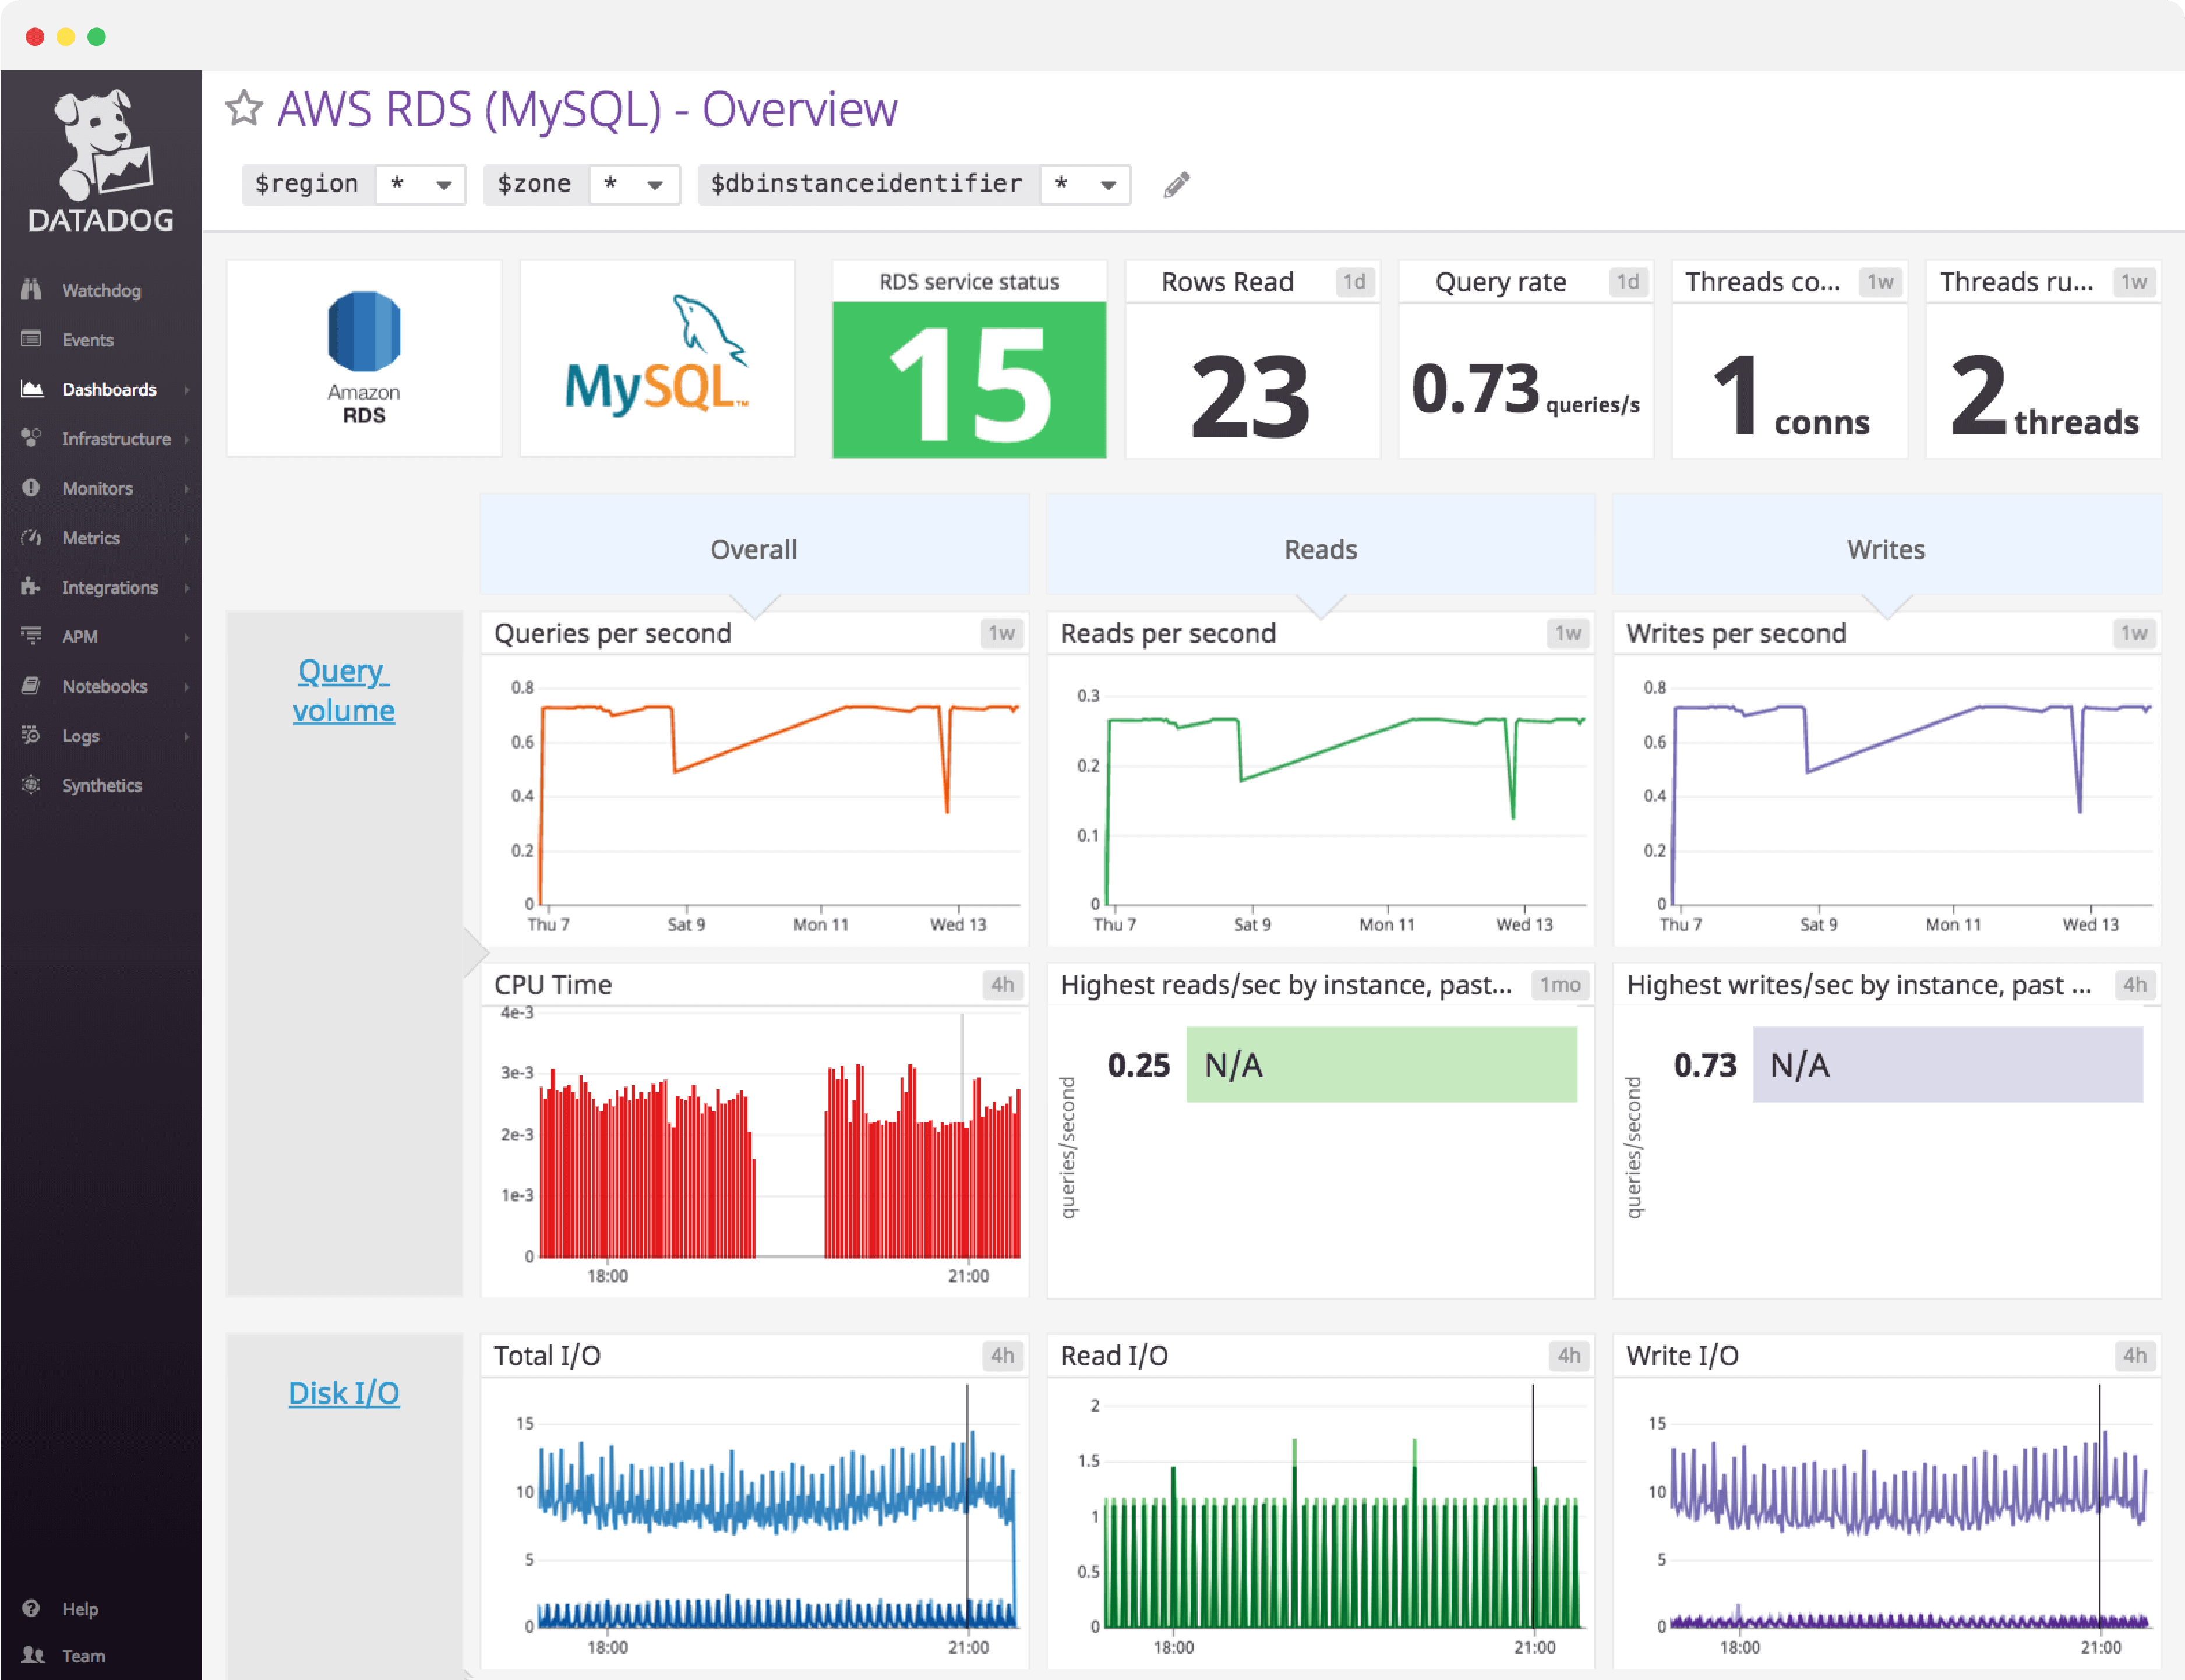
RDS MySQL dashboard overview
RDS MySQL users can access RDS metrics via Amazon CloudWatch and native MySQL metrics from the database instance itself. Each metric type gives you different insights into MySQL performance. Ideally, both RDS and MySQL metrics should be collected in your dashboard for a comprehensive view.
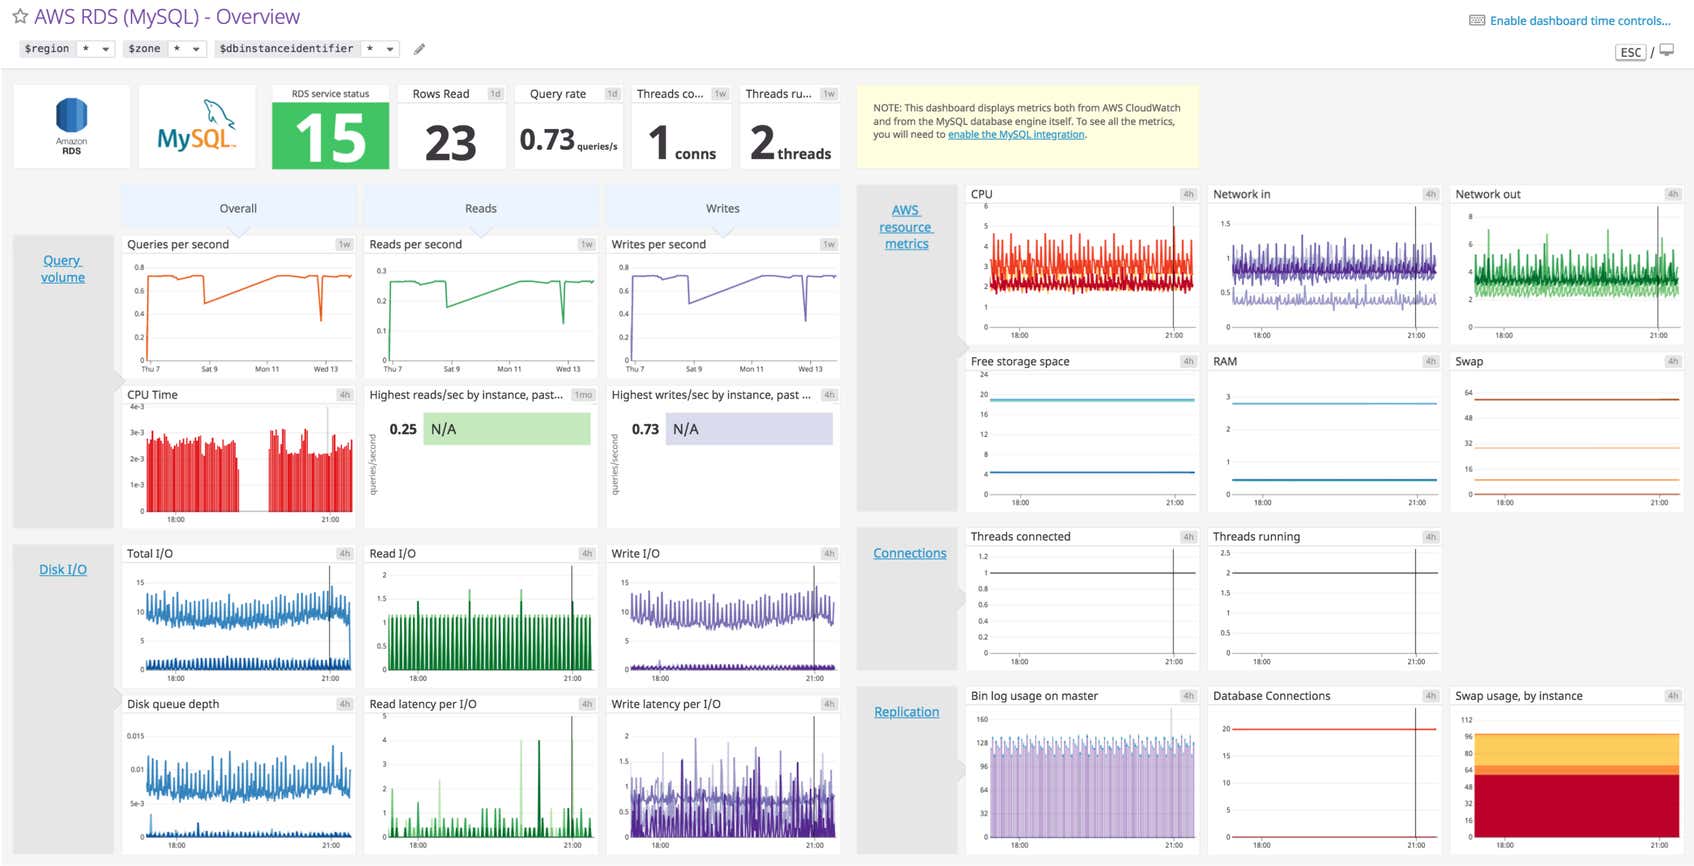
Datadog’s RDS MySQL dashboard visualizes the key query volume, disk I/O, connecton, replication, and AWS resource metrics you should track in a single pane of glass. This page breaks down the information featured on that dashboard to provide a starting point for anyone looking to monitor RDS MySQL.
What is RDS MySQL?
Amazon Relational Database Service (RDS) is a hosted database service in the AWS cloud. Users can choose from several relational database engines, including MySQL, Oracle, SQL Server, PostgreSQL, MariaDB, and Amazon Aurora. RDS MySQL is the original database engine for the service.
Set up real-time RDS MySQL monitoring in minutes with Datadog's out-of-the-box dashboard.
RDS MySQL dashboard metrics breakdown
Query volume metrics
Queries per second
The number of queries per second. The current rate of queries will naturally rise and fall but it is worth alerting on sudden changes in query volume — drastic drops in throughput, especially, can indicate a serious problem.
Slow queries
Slow_queries is a native MySQL performance metric for query latency that increments every time a query’s execution time exceeds the number of seconds specified by the long_query_time parameter (which can be set in the AWS console).
If the number of slow queries reaches worrisome levels, you will want to identify the actual queries that are executing slowly so you can optimize them.
Reads per second
Depending on whether or not the read is served from the query cache, reads increment one of two MySQL metrics (Com_select or Qcache_hits). These metrics can also be summed and reads per second can be further broken down by providing instance-specific data about each read over time.
Writes per second
Similar to Reads per second all INSERT, UPDATE, and DELETE commands are rolled into one metric. This metric can be further broken down by providing instance-specific data about each write over time.
Disk I/O metrics
Total I/O
The sum of read IOPS (input/output operations per second) and write IOPS for the MySQL instance. Note there is not a one-to-one correspondence between queries and I/O operations.
Monitoring total IOPS ensures that you do not exceed the limits of your chosen instance type. It also helps you understand how much of your workload is served from memory and how much must be retrieved from disk.
Read/Write I/O
The number of read or write IOPS.
Disk queue depth
The DiskQueueDepth metric measures the length of the I/O operations queue when storage volumes cannot keep pace with the volume of read and write requests.
Although it is not unusual to have some requests in the disk queue, you might have to investigate further if this metric climbs—especially if latency increases as a result.
Read latency per I/O
This metric measures how long your read I/O operations are taking at the disk level. To overcome I/O limitations in read-heavy applications, you can create read replica of the database to serve some of the client read requests.
Write latency per I/O
This metric measures how long your write I/O operations are taking at the disk level.
Connection metrics
Threads connected
The Threads_connected metric counts connection threads in MySQL (one thread is allocated per connection). This native MySQL metric can be collected at a higher resolution than the CloudWatch DatabaseConnections metric.
Threads running
The Threads_running metric isolates the threads that are actively processing queries.
Set up real-time RDS MySQL monitoring in minutes with Datadog's out-of-the-box dashboard.
Replication metrics
Bin log usage on source
This metric is relevant for replication scenarios because it measures the disk usage of binary logs on the source database instance.
Replication lag
The ReplicaLag CloudWatch metric captures the lag time for any read replica. While this metric is usually not actionable, you should investigate your settings and resource usage if the lag is consistently very long. This metric can be further broken down to provide instance-specific data.
AWS resource metrics
CPU
This metric measures CPU utilization. While high CPU utilization is not necessarily a bad sign, it could indicate a bottleneck if your database is performing poorly while it is within IOPS and network limits and appears to have sufficient memory.
Network in
The network traffic received by the MySQL instance per second. Monitoring NetworkReceiveThroughput and NetworkTransmitThroughput metrics helps you identify potential network bottlenecks.
Network out
The network traffic transmitted by the MySQL instance per second.
Free storage space
The CloudWatch FreeStorageSpace metric lets you monitor how much of your allocated storage is still available. AWS recommends that RDS users take action to delete unneeded data or add more storage if disk usage consistently reaches levels of 85 percent or more.
RAM
The CloudWatch FreeableMemory metric tracks available RAM.
Swap
The CloudWatch SwapUsage metric is used to monitor memory saturation, showing you how much swap is used on the instance.
See metrics in our RDS MySQL dashboard in minutes
If you’d like to start visualizing your RDS MySQL data in our out-of-the-box dashboard, try Datadog for free. The RDS MySQL dashboard will be populated immediately after you set up the RDS MySQL integration.
For a deep dive on RDS MySQL metrics and how to monitor them, check out our three-part How to Monitor RDS MySQL series.