OpenStack dashboard overview
OpenStack metrics can be logically grouped into four categories. Hypervisor metrics give a clear view of the work performed by your hypervisors, Nova server metrics give you a window into your virtual machine instances, tenant metrics provide detailed information about user resource usage (including quotas), and finally, message queue metrics give you performance details about the underlying message-passing pipeline Nova uses to coordinate work.
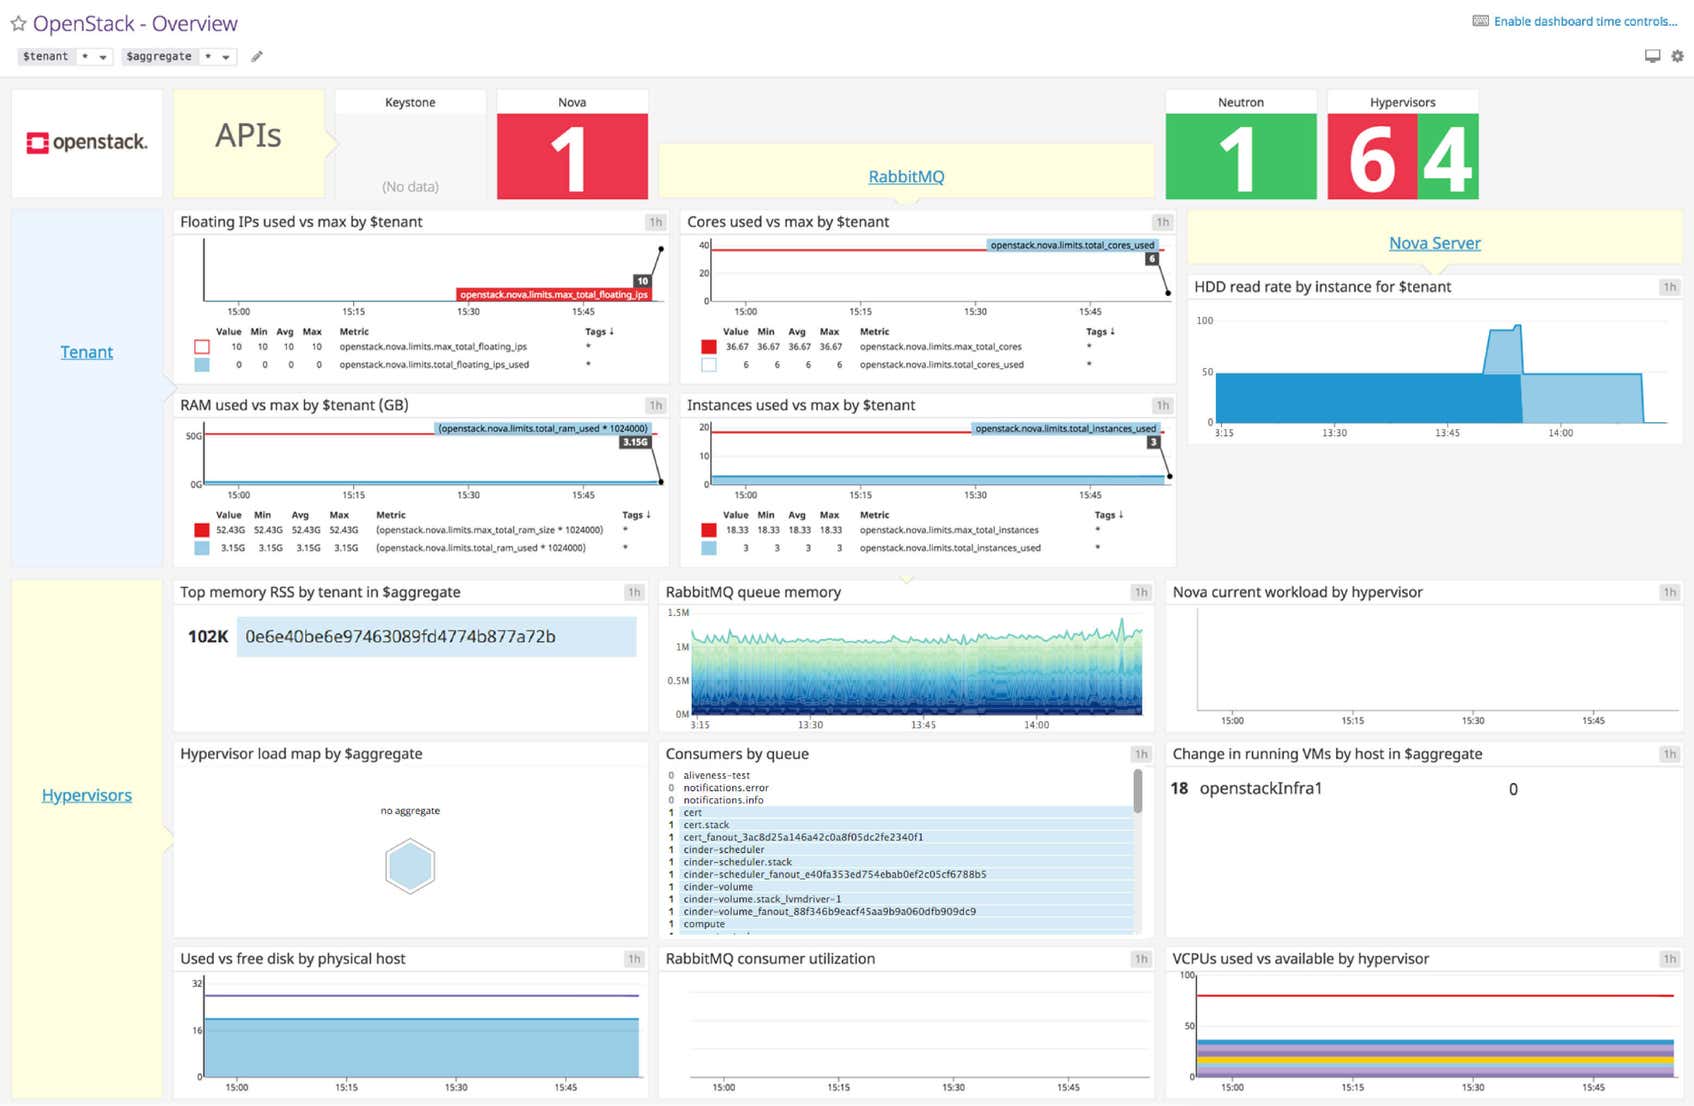
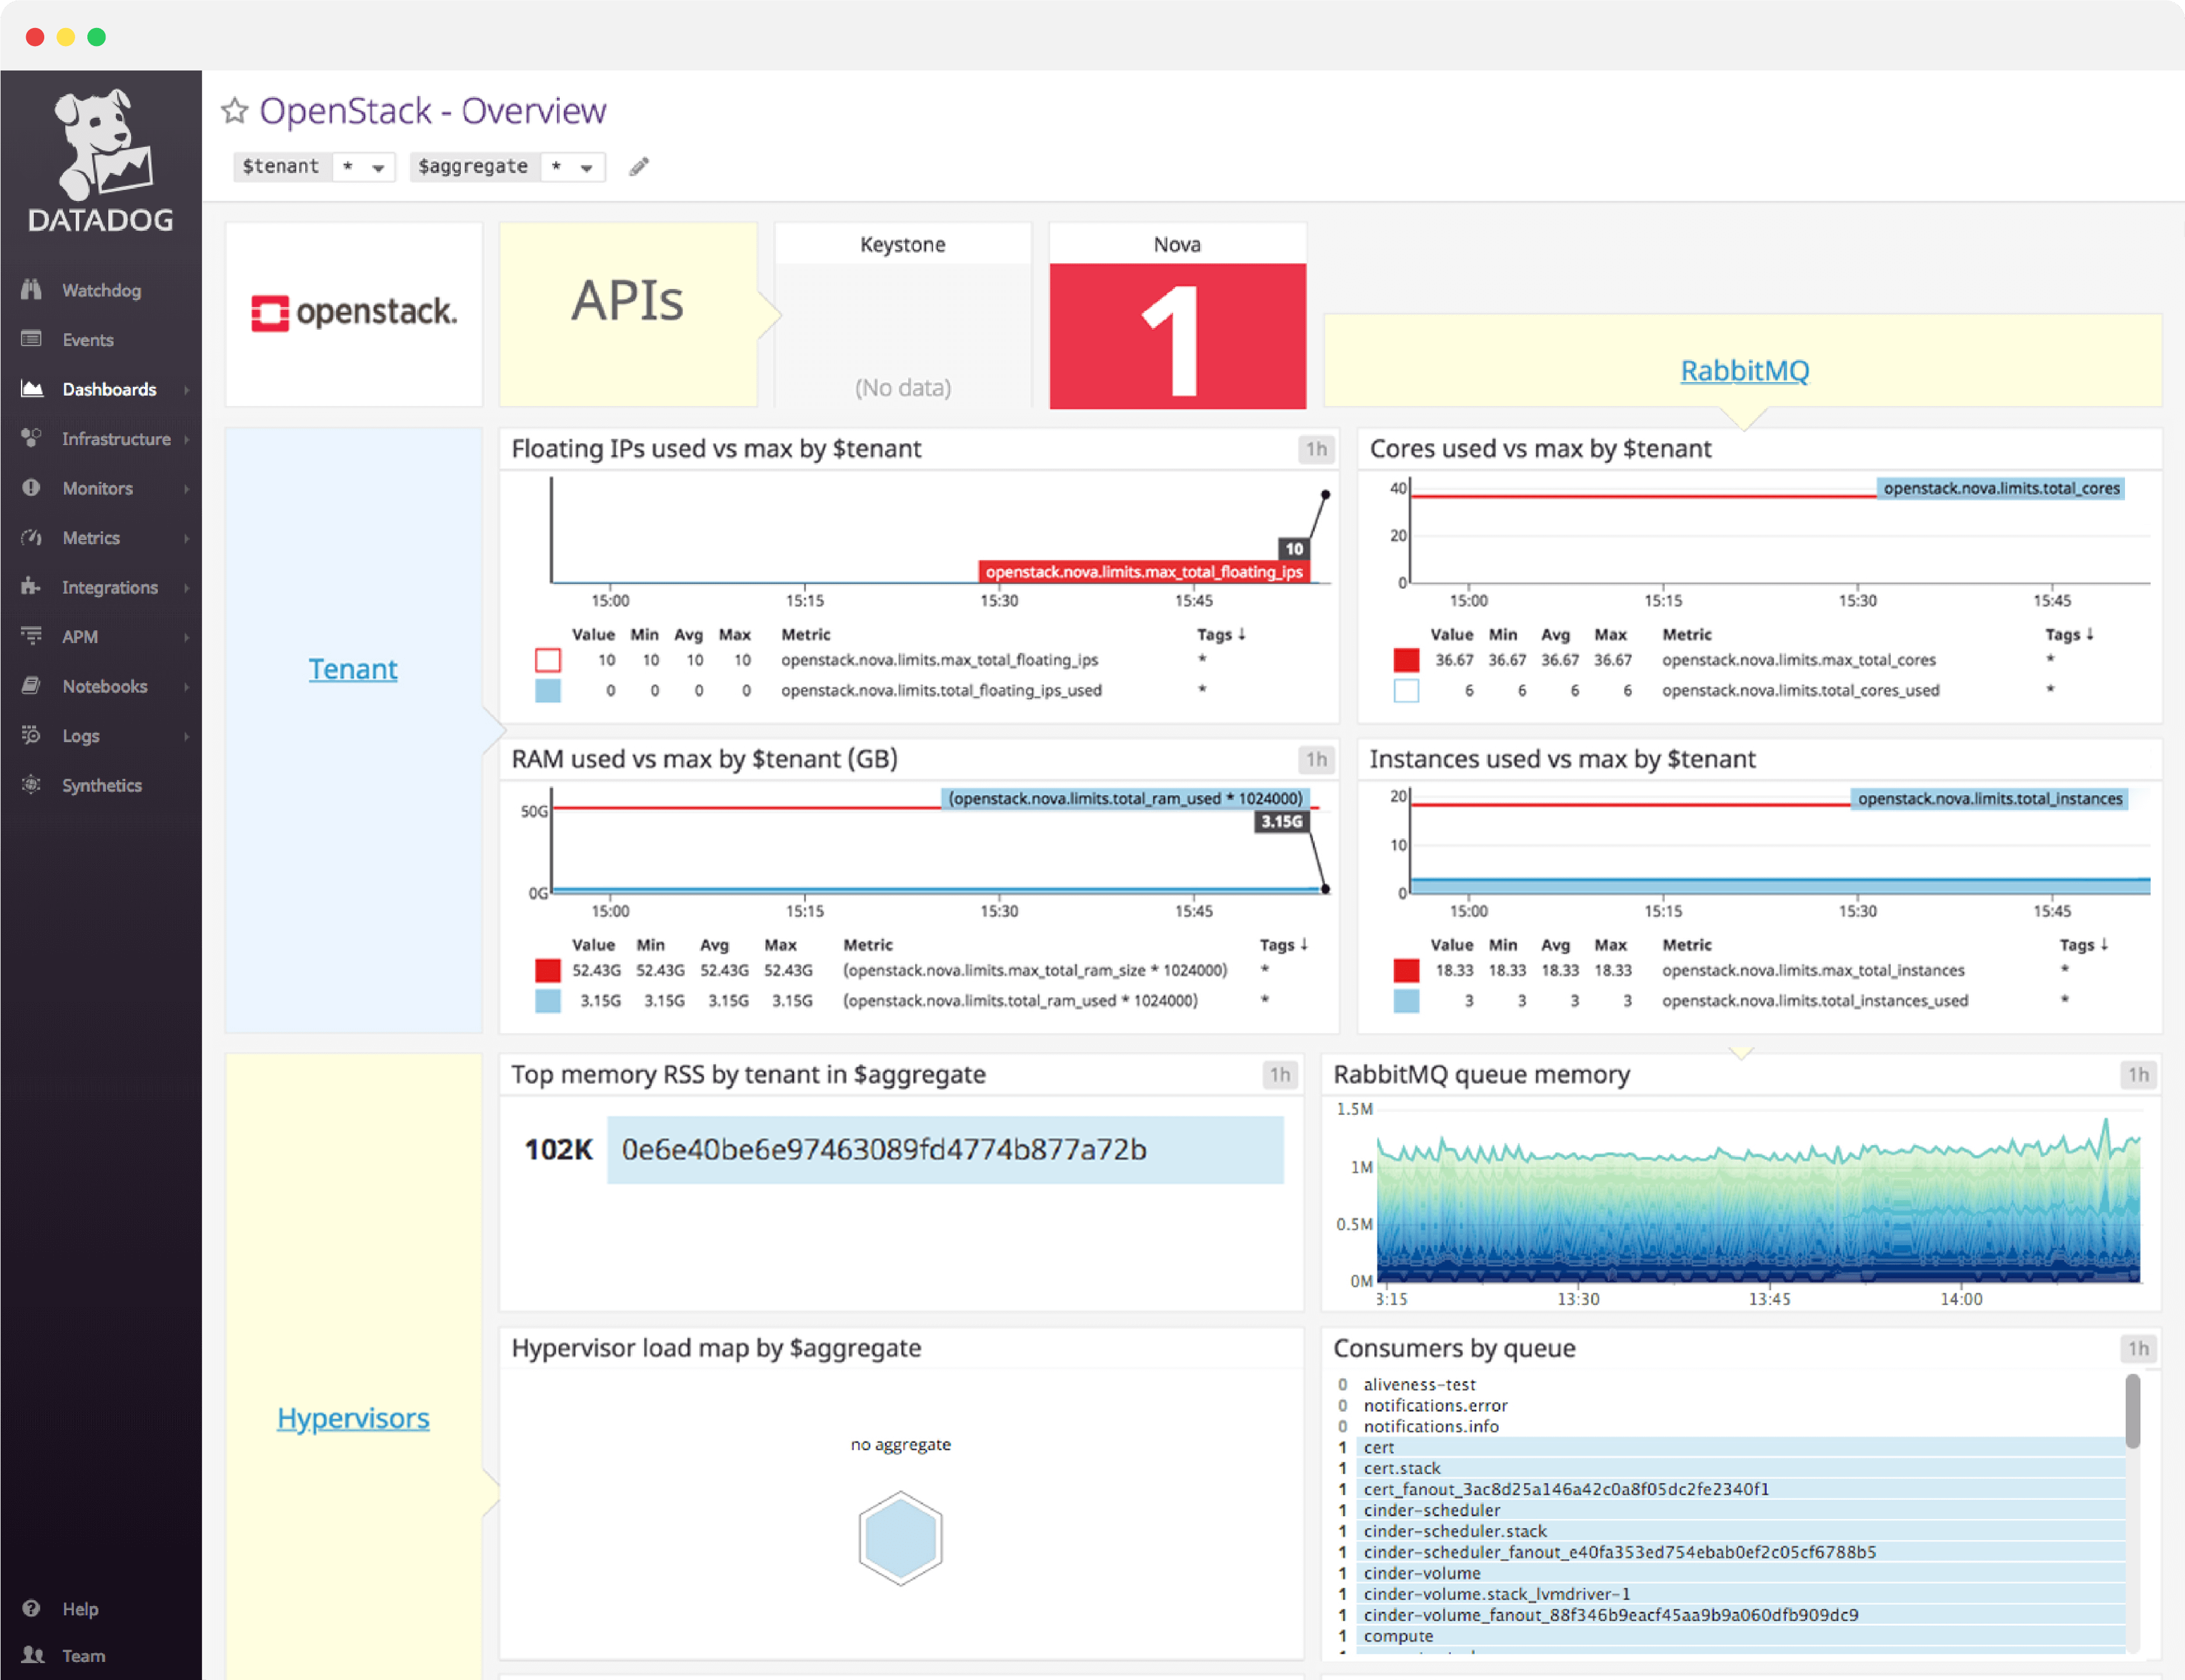
Datadog’s OpenStack dashboard visualizes the key status information and metrics to track in a single pane of glass. This page breaks down the metrics featured on that dashboard to provide a starting point for anyone looking to monitor OpenStack.
What is OpenStack?
OpenStack is an open-source cloud-computing software platform. It is primarily deployed as infrastructure-as-a-service and can be likened to a version of Amazon Web Services that can be hosted anywhere. Originally developed as a joint project between Rackspace and NASA, OpenStack has a large number of high-profile corporate supporters, including Google, Hewlett-Packard, Comcast, IBM, and Intel.
The core of the OpenStack project lies in the compute module, known as Nova. Nova is responsible for the provisioning and management of virtual machines. It features full support for KVM and QEMU out-of-the-box, and partial support for other hypervisors including VMWare, Xen, and Hyper-V.
Set up real-time OpenStack monitoring in minutes with Datadog's out-of-the-box dashboard.
OpenStack dashboard metrics breakdown
OpenStack status metrics
Nova, Neutron, and Keystone status
These metrics provide the number of running Nova, Neutron, and Keystone API endpoints. Because the number of physical hosts should change infrequently, you can expect these numbers to be static. Changes may point to down API endpoints, which means there is trouble in your deployment.
Hypervisor status
Provides the number of hypervisors that are up and running. This number can also be said to reflect the number of Nova nodes running, as each Nova node has one hypervisor. Unexpected changes to this metric point to problems with your Nova cluster.
Nova server metrics
Computing nodes generally constitute the majority of nodes in an OpenStack deployment. Nova server metrics provide information on individual instances operating on computation nodes.
HDD read rate by instance
The average rate of read requests per second per instance. Spikes in this metric indicate that a virtual machine may have low RAM, causing it to thrash the disk with constant memory paging.
Hypervisor metrics
The hypervisor initiates and oversees the operation of virtual machines. Failure of this critical piece of software will cause tenants to experience issues provisioning and performing other operations on their virtual machines, so monitoring the hypervisor is crucial.
Top memory RSS
The current resident set size (RSS) of the nova-compute daemon (VM instance manager), grouped by host aggregate. Although this metric should fluctuate under normal conditions, any dramatic changes should be investigated.
Hypervisor load
This metric tracks the system load by hypervisor over a given timeframe.
Used/Free disk space
The amount of disk space (in gigabytes) currently available for allocation, aggregated by physical host. Maintaining ample disk space is critical, because the hypervisor will be unable to spawn new virtual machines if there isn’t enough available space.
Current workload by hypervisor
These metric tracks the specific hypervisor operations: Build, Snapshot, Migrate, and Resize.
Change in running VMs
This metric help monitor changes in the number of instances running on each host. Depending on your use case, unexpected changes to this metric should be investigated.
vCPUs used vs available
The number of virtual CPUs in use against the maximum number available. Remember, OpenStack allows you to overcommit RAM and CPU resources. This means you can increase the number of resources available to your instances, at the cost of performance.
RabbitMQ metrics
RabbitMQ serves both as a synchronous and asynchronous communications channel for Nova. Failure of this component will disrupt operations across your deployment. Monitoring RabbitMQ is essential if you want the full picture of your OpenStack environment.
Queue memory
The memory usage of RabbitMQ, broken down by queue. Although not often an issue, a significant spike in queue memory could point to a large backlog of unreceived (“ready”) messages, or worse.
Consumer utilization
The utilization of each queue, represented as a percentage. Ideally, this metric will be 100 percent for each queue, meaning consumers get messages as quickly as they are published. This metric is only available in RabbitMQ 3.3 and greater.
Your number of consumers should usually be non-zero for a given queue. Zero consumers means that producers are sending out messages into the void. Depending on your RabbitMQ configuration, those messages could be lost forever.
Set up real-time OpenStack monitoring in minutes with Datadog's out-of-the-box dashboard.
Tenant metrics
Tenant metrics are primarily focused on resource usage. Remember, tenants are just groups of users. In OpenStack, each tenant is allotted a specific amount of resources, subject to a quota. Monitoring these metrics allows you to fully exploit the available resources and can help inform requests for quota increases should the need arise.
Floating IPs used vs max
The number of floating IPs used by the tenant against the maximum number of floating IPs allowed.
RAM used vs max
The RAM used by the tenant against the maximum RAM allocated.
Cores used vs max
The current number of cores in use against the maximum number of cores allocated.
Instances used vs max
The current number of instances running against the maximum number of instances allowed. Remember, if a tenant is close to nearing their instance limit, they can always resize the instance to a larger one, if other resource quotas permit.
See your metrics in our OpenStack dashboard in minutes
If you’d like to start visualizing your OpenStack data in our out-of-the-box dashboard, you can try Datadog for free. The OpenStack dashboard will be populated immediately after you set up the OpenStack integration.
For a deep dive on OpenStack metrics and how to monitor them, check out our four-part OpenStack monitoring series.