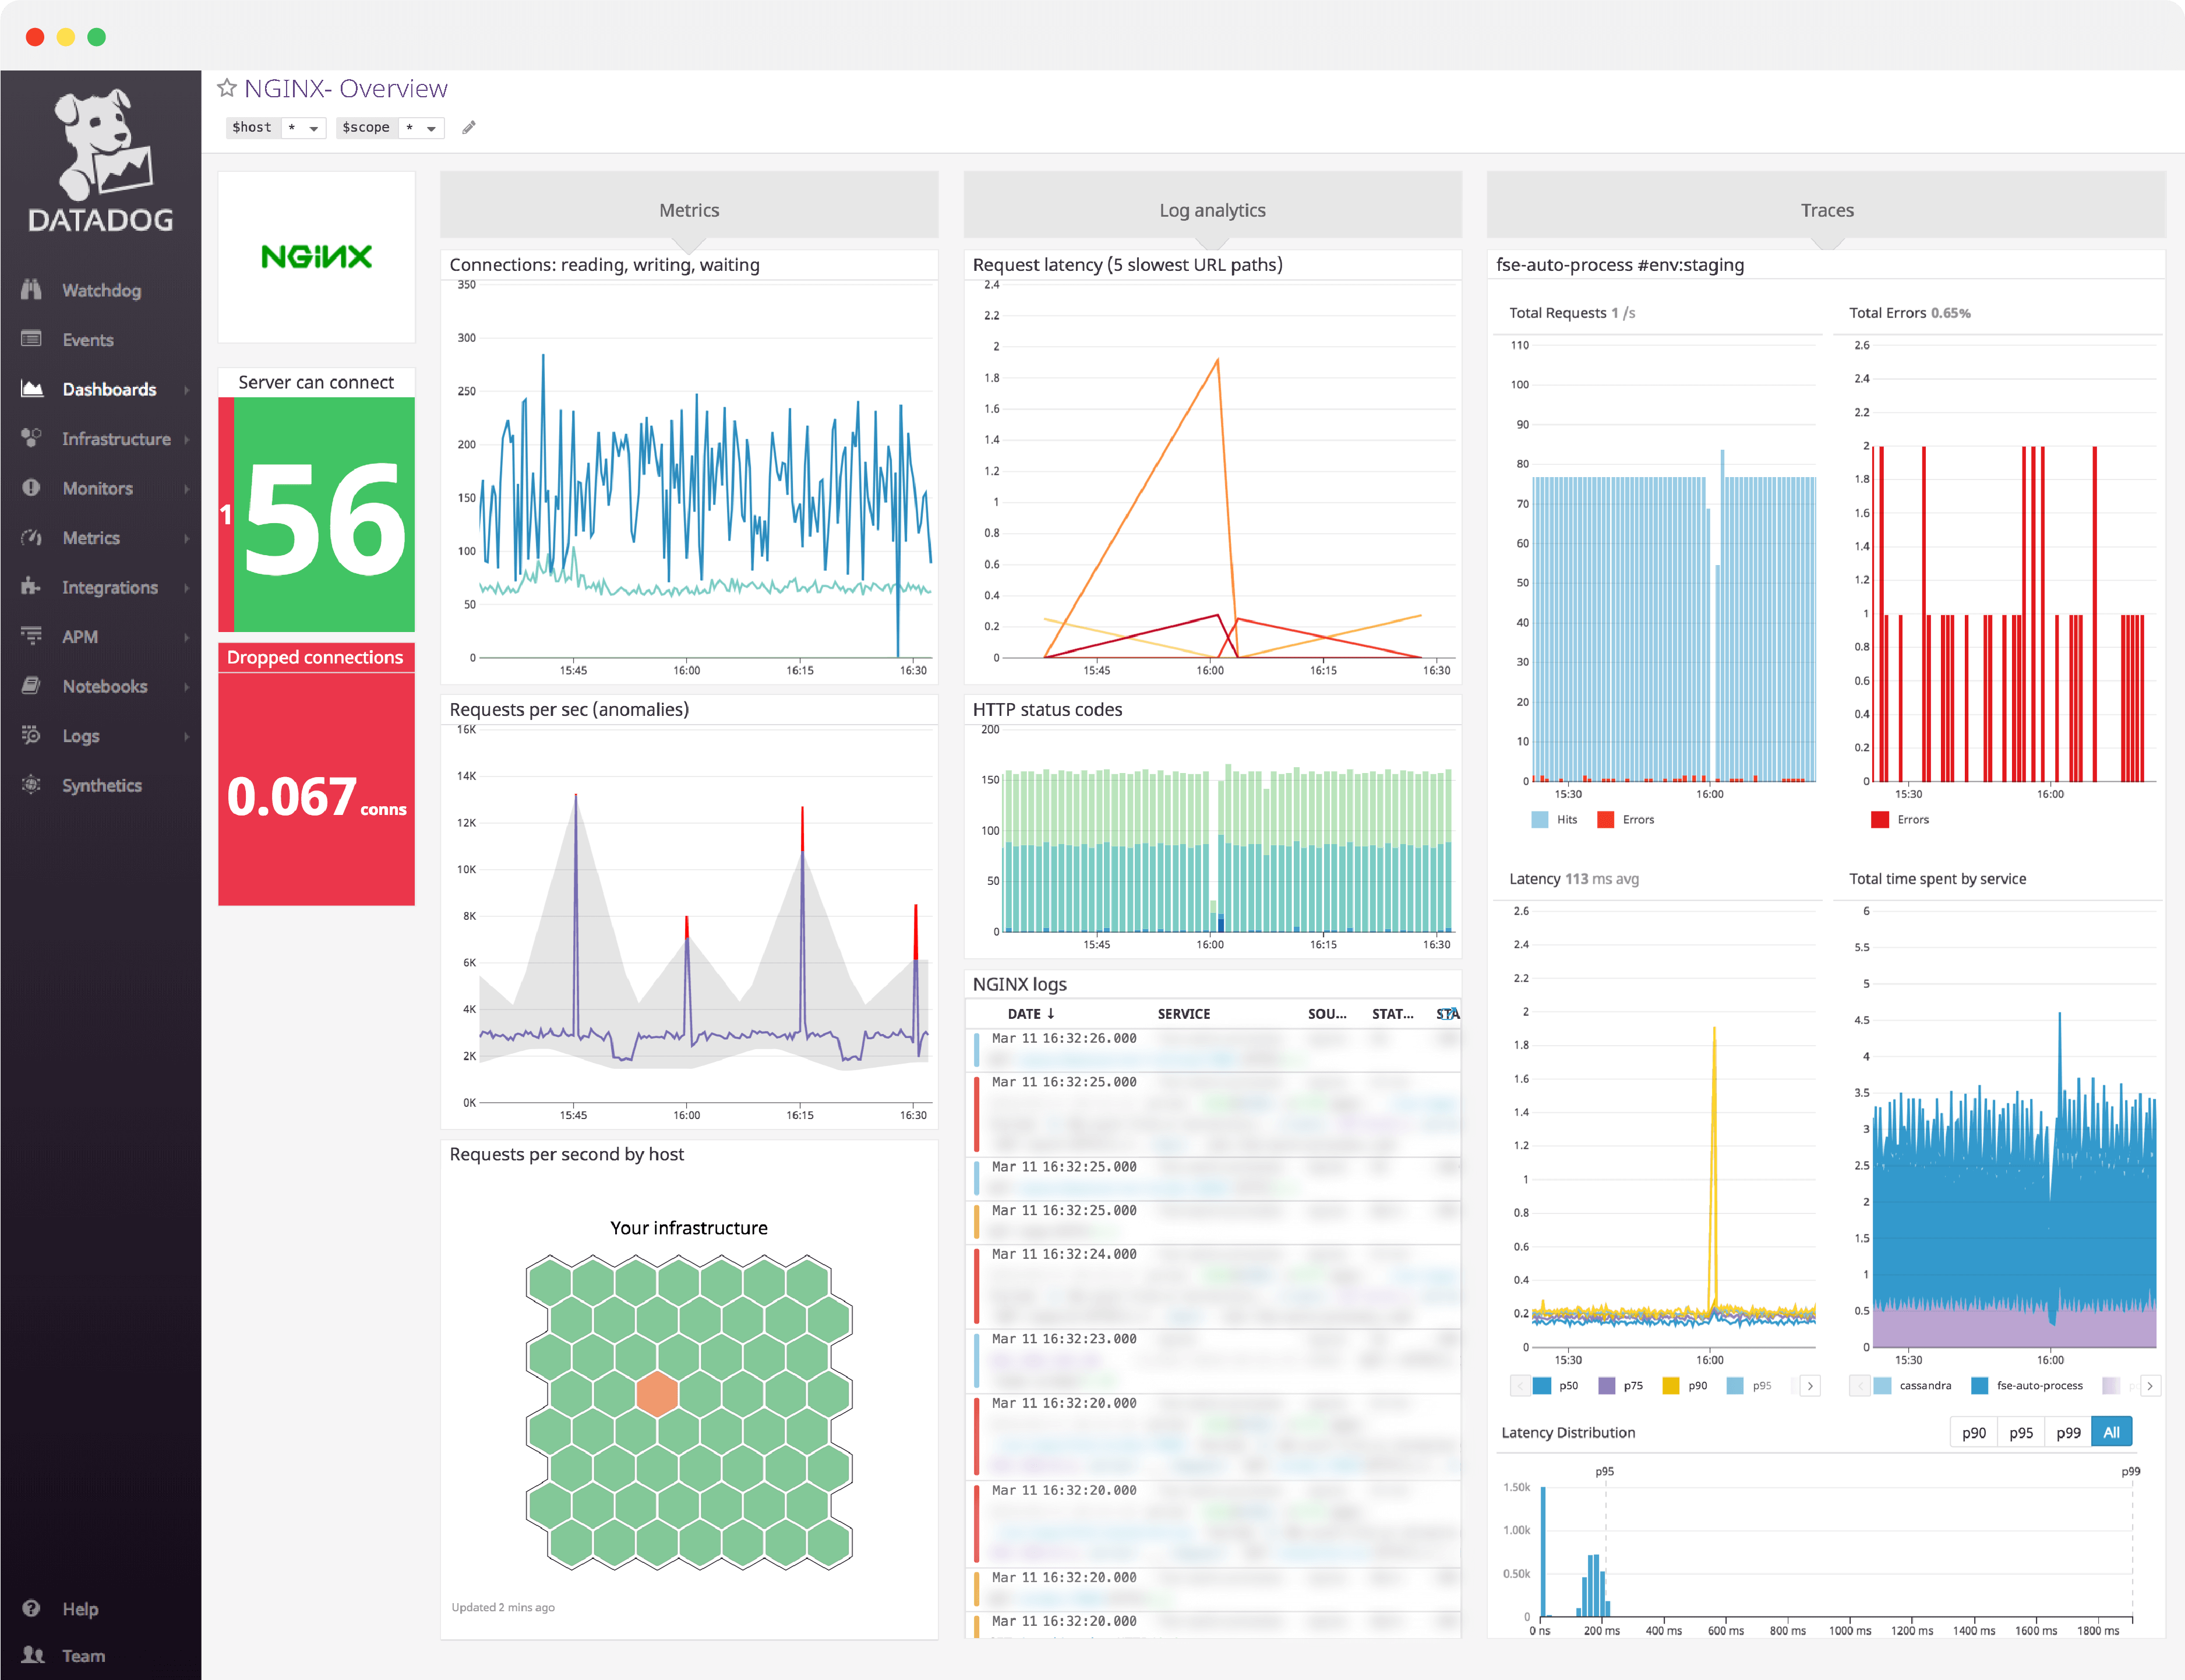
NGINX dashboard overview
As you build a dashboard to monitor NGINX, you will want to gain insight into the metrics NGINX exposes about client connections, request processing, and all the system metrics (CPU, memory, I/O, etc.) from your NGINX servers.
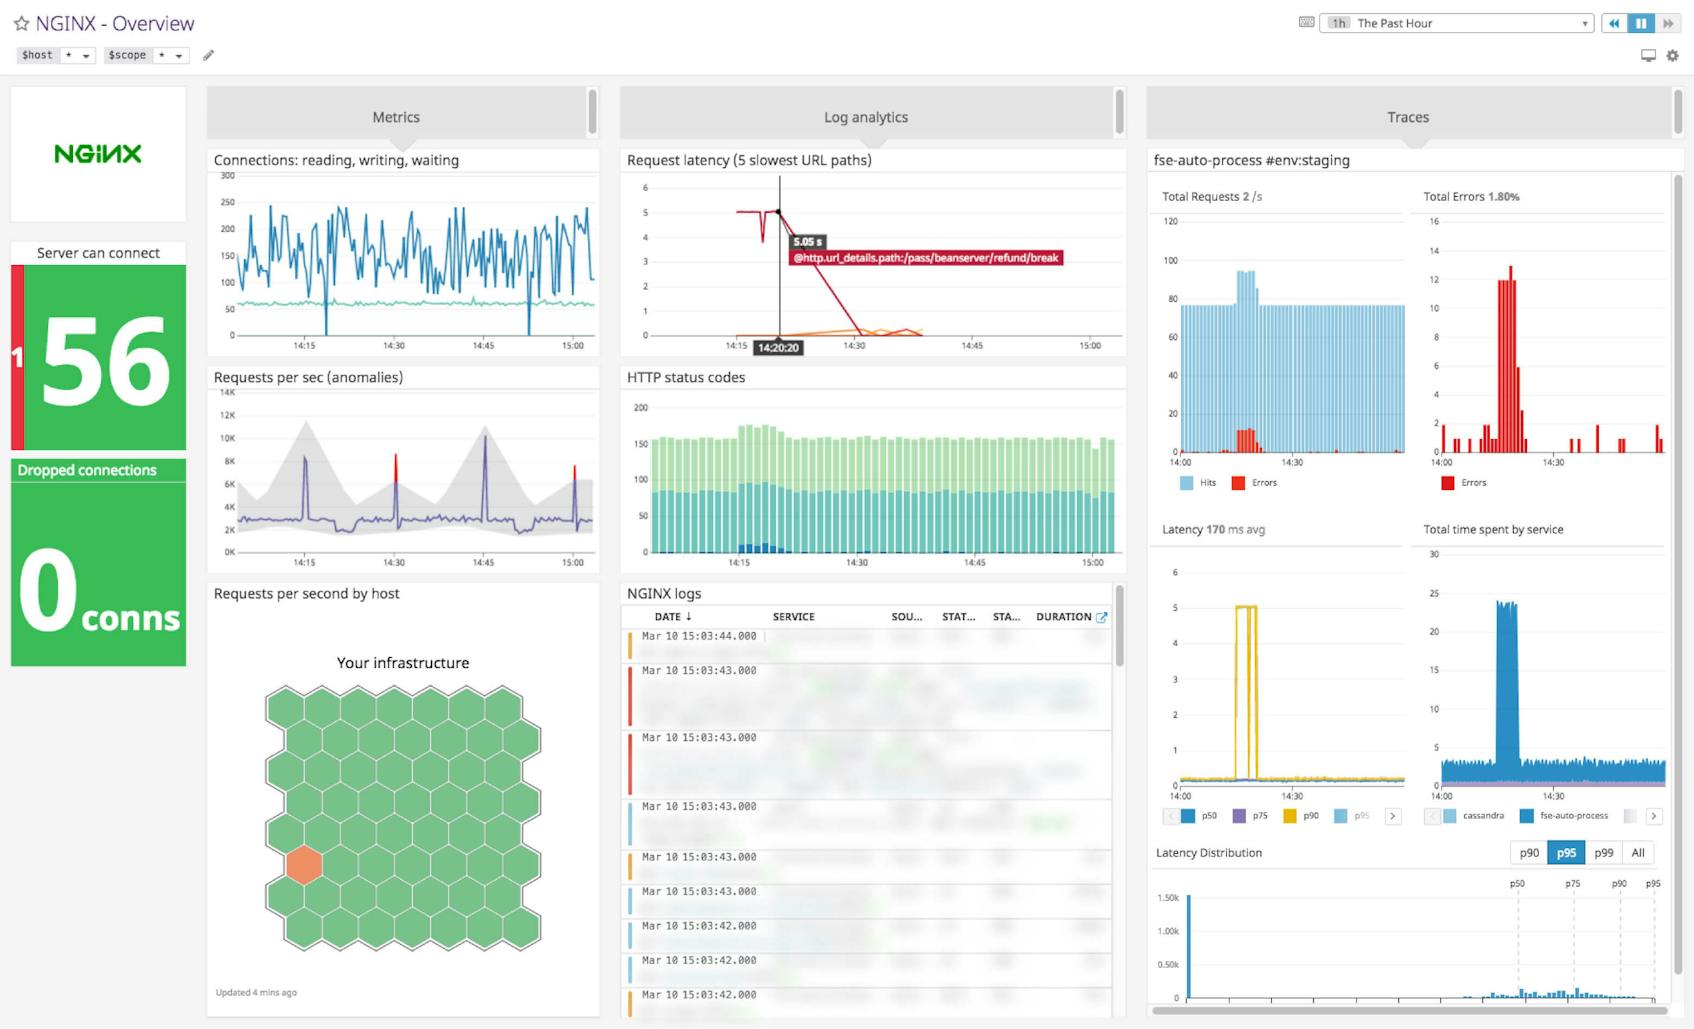
Datadog’s NGINX dashboard visualizes key pieces of information for each metric category in a single pane of glass. This page breaks down the metrics featured on that dashboard to provide a starting point for anyone looking to monitor NGINX.
What is NGINX?
NGINX (pronounced “engine X”) is a popular HTTP server and reverse proxy server. As an HTTP server, NGINX serves static content very efficiently and reliably, using relatively little memory. As a reverse proxy, it can be used as a single, controlled point of access for multiple backend servers or for additional applications such as caching and load balancing.
Set up real-time NGINX monitoring in minutes with Datadog's out-of-the-box dashboard.
NGINX dashboard metrics breakdown
Requests per second
This metric tracks the request rate across all your NGINX servers for a high-level view of server throughput.
Monitoring the average of this metric can alert you to spikes in incoming web traffic, whether legitimate or nefarious, or sudden drops, which are usually indicative of problems. A drastic change in requests per second can alert you to problems brewing somewhere in your environment, even if it cannot tell you exactly where those problems lie.
Monitoring this metric by individual host is useful in identifying hotspots in your web infrastructure — if one subset of servers is processing an undue amount of requests, those servers will stand out.
Requests - reading, writing, waiting
These metrics indicate the flow of requests through NGINX in the context of active client connections.
When a request is received, the request is counted as Reading while NGINX reads the client request header. Request headers are lightweight, so this is usually a short-lived state, and the value of the Reading metric should be very small.
After the request is read, it is counted as Writing, and remains in that state until a response is returned to the client. Because Writing includes the time that NGINX is waiting for results from upstream systems, requests will often spend the majority of their time in the Writing state.
Waiting indicates an active connection that currently has no active client request being processed.
See your NGINX data in minutes with Datadog's out-of-the-box NGINX dashboard.
Dropped connections
A dropped connection means that NGINX could not establish a new connection or reuse an existing one; this often indicates that a resource limit, such as NGINX’s worker_connections limit, has been reached. Under normal circumstances, dropped connections should be zero.
Tracking dropped connection rates over time allows you to determine at a glance whether any dropped connections were the result of a short-lived anomaly or are the sign of a serious problem. Because virtually any dropped connections are cause for concern any rate greater than one dropped connection per second should be considered an error.
Active connections
Once NGINX successfully handles a connection, the connection moves to an active state, where it remains as client requests are processed. In protocols where a connection supports only one connection at a time, this metric is the sum of Reading requests, Writing requests, and Waiting connections.
See your metrics in our NGINX dashboard in minutes
If you’d like to start visualizing your NGINX data in our out-of-the-box dashboard, you can try Datadog for free. The NGINX dashboard will be populated immediately after you set up the NGINX integration.
For a deep dive on NGINX metrics and how to monitor them, check out our three-part How to monitor NGINX series.