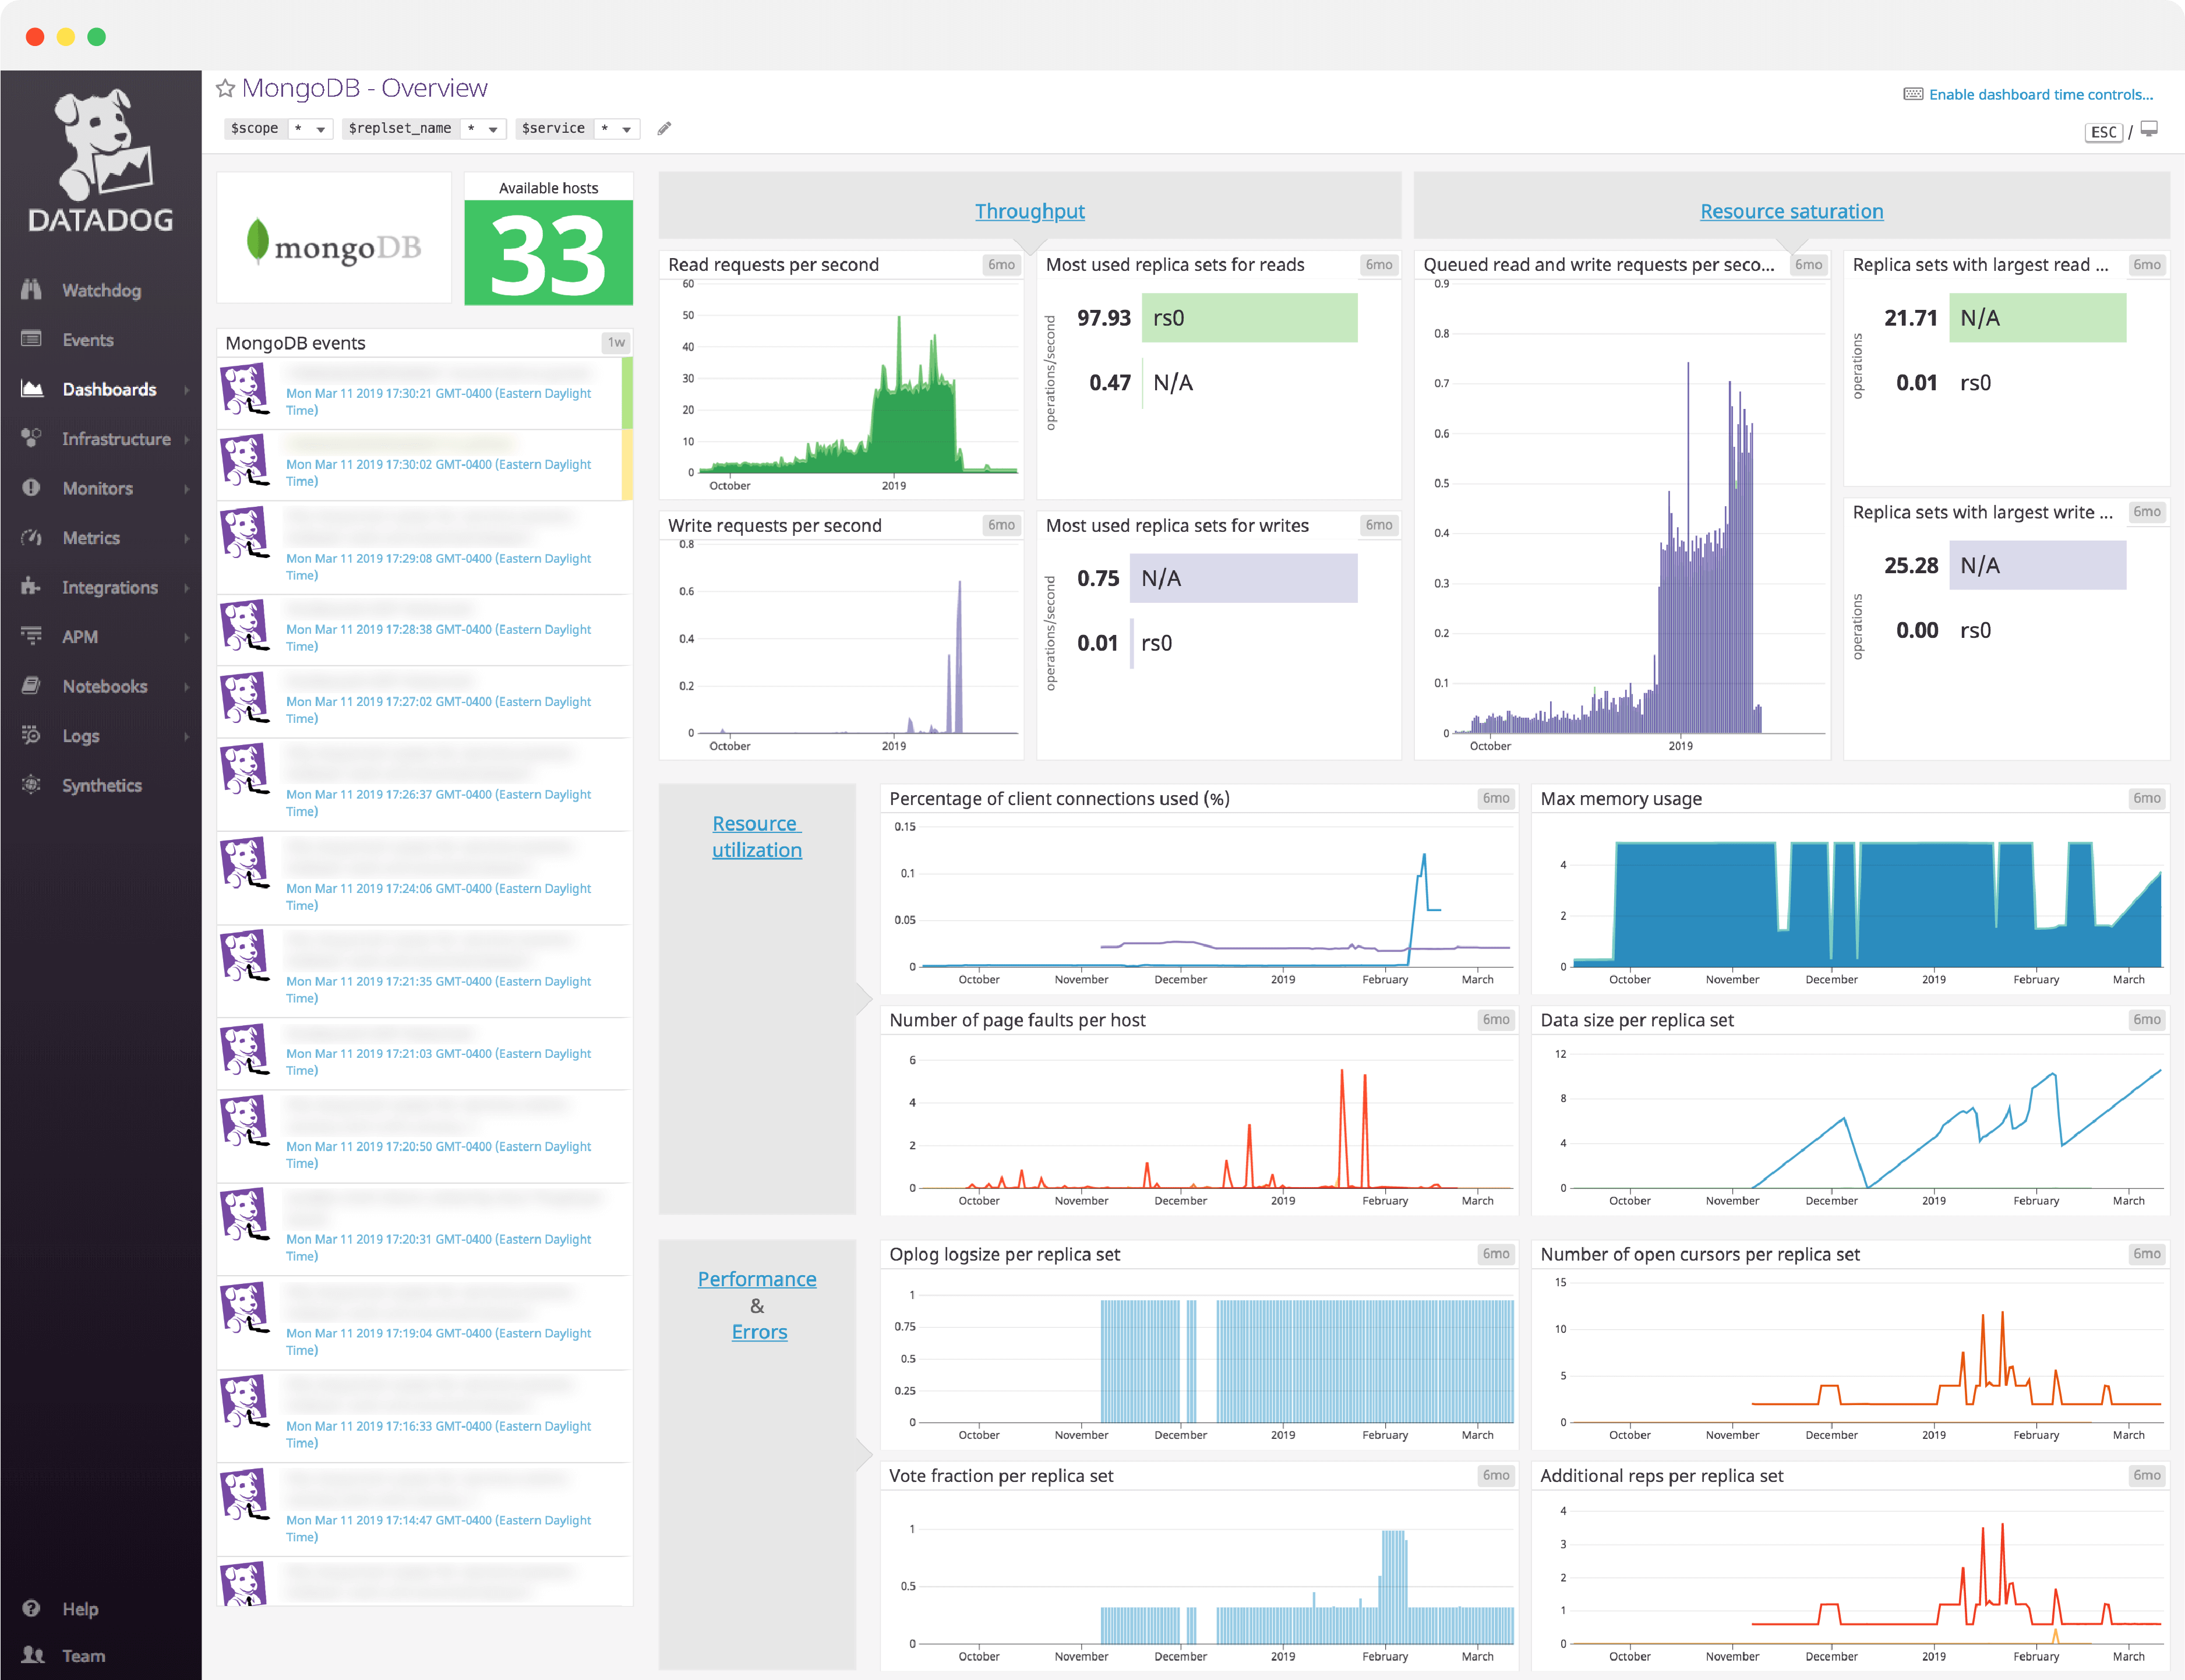
MongoDB dashboard overview
MongoDB can be monitored with five key metric categories: throughput, resource saturation, resource utilization, errors (asserts), and database performance. However, the available metrics and their relative importance depend on the storage engine you are using – WiredTiger, which is now the default, or MMAPv1, which was the default in earlier versions of MongoDB.
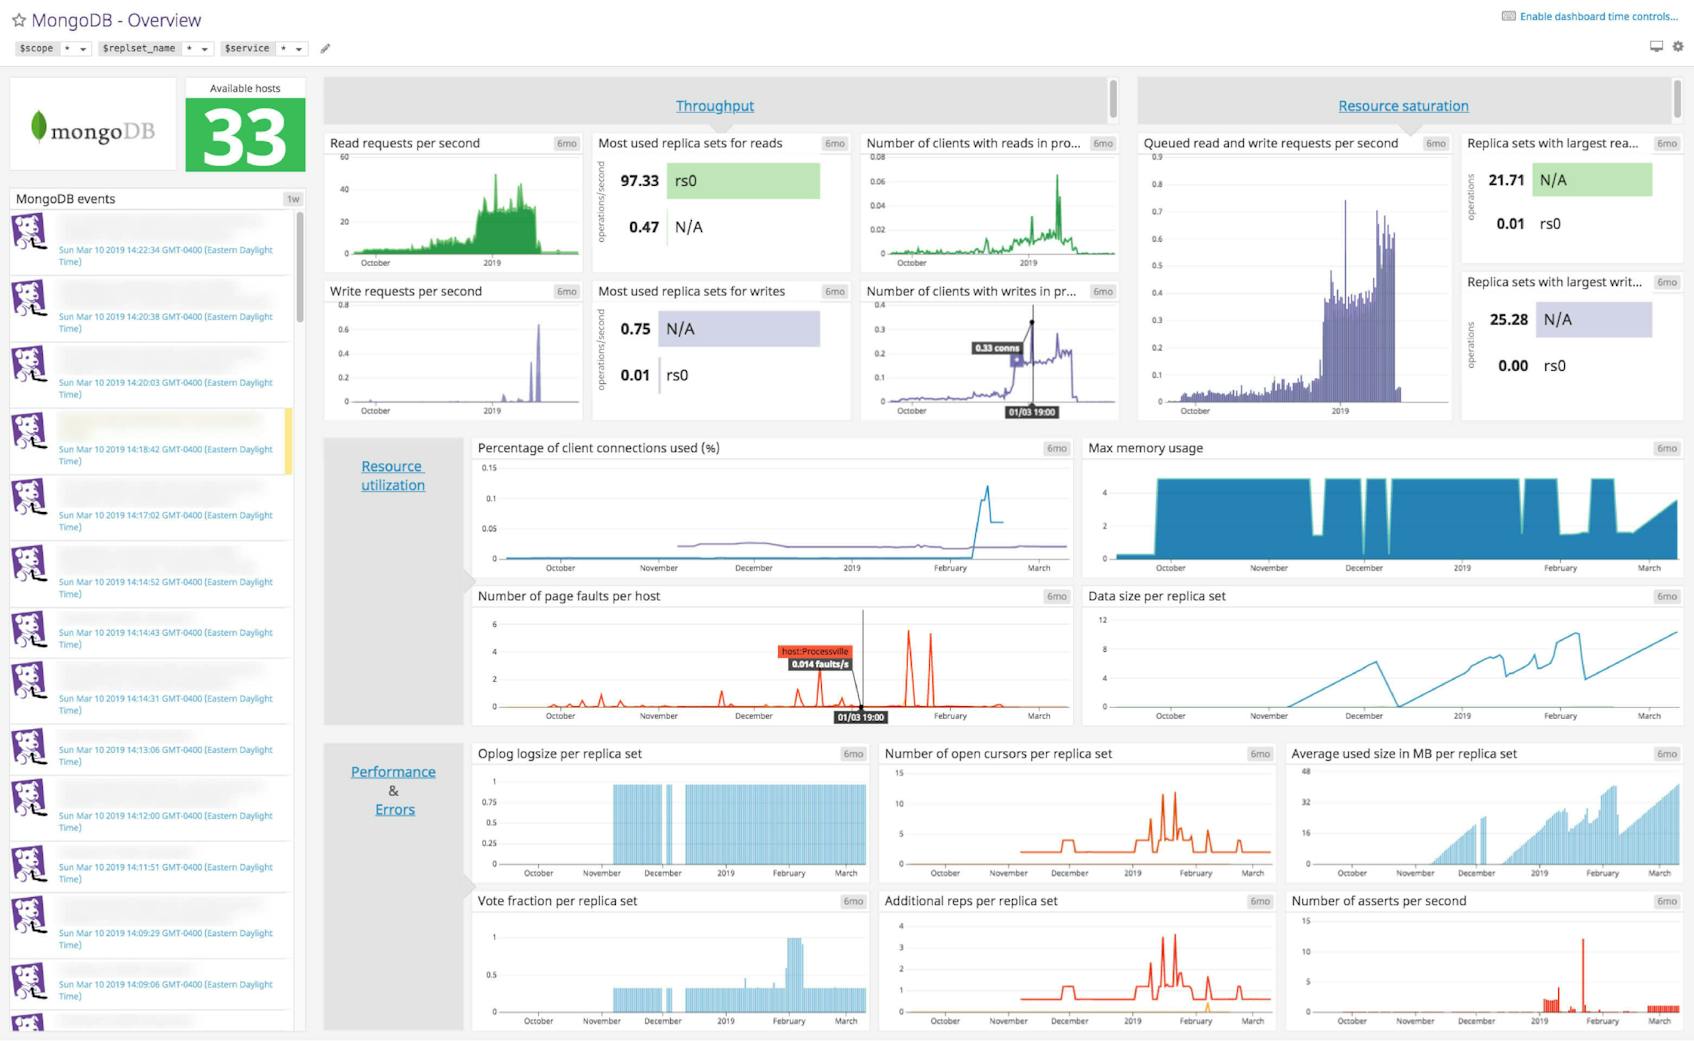
Datadog’s comprehensive MongoDB dashboard displays key pieces of information for each metric category in a single pane of glass. This page breaks down the metrics featured on that dashboard to provide a starting point for anyone looking to monitor MongoDB performance.
What is MongoDB?
MongoDB is a document-oriented database which stores data as documents, thus offering more flexible structure than other databases. MongoDB is cross-platform and represents its documents in a binary-encoded JSON format called BSON (Binary JSON). This lightweight binary format adds speed to the flexibility of the JSON format, along with more data types.
MongDB’s replication mechanisms and horizontal scalability allowed by sharding help it ensure high availability. It is used by companies such as Facebook, eBay, Foursquare, Squarespace, Expedia, and Electronic Arts.
Set up real-time MongoDB monitoring in minutes with Datadog's out-of-the-box MongoDB dashboard.
MongoDB dashboard metrics breakdown
Note that the metrics covered in this breakdown are common to both storage engines, with the exception of the average duration of background flushes per replica set (seconds) and max memory usage, which are unique to MMAPv1.
Throughput metrics
Read requests per second
The number of read requests received by your MongoDB cluster per second.
Write requests per second
The number of write requests received by your MongoDB cluster per second. Setting alerts on the number of read and write requests can help you prevent resource saturation, spot bottlenecks, and know when to scale up or out.
Number of clients with reads/writes in progress or queued
The activeClients.readers metric shows how many active clients have read operations in progress or queued and the activeClients.writers metric shows how many active clients have write operations in progress or queued.
Monitoring these two activeClient metrics helps show whether or not the number of active clients explains the requests load.
Most used replica sets for reads/writes
A replica set represents multiple servers running MongoDB, each one containing the exact same data. They provide fault tolerance and high data availability. Tracking this metric shows which replica sets are receiving the most read/write operations.
Resource saturation metrics
Queued read and write requests per second
The number of read and write requests that are currently queued. If you see this queue continuously growing during heavy read/write traffic, MongoDB is not addressing requests as fast as they are arriving. This indicates that you should increase your deployment capacity.
Replica sets with largest read queues
This metric shows which replica sets have the largest queues of read requests.
Replica sets with largest write queues
This metric tracks which replica sets have the largest queues of write requests.
Resource utilization metrics
Percentage of client connections used
The percentage of connections used continuously helps monitor resource utilization under low, normal, and peak traffic so you can appropriately set your alerts. If MongoDB runs on low connections, it may not be able to handle incoming requests in a timely manner.
Number of page faults per host
Page faults indicate operations which required MongoDB to fetch data from the disk because it wasn’t available in active memory (“hard” page fault), or when the operation required in-memory page relocation (“soft” page fault).
It is important to alert on this metric because frequent page faults may indicate that your data set is too large for the allocated memory. Page faults can also be a sign of inefficient schema design, redundant or unnecessary indexes, or anything using available RAM unnecessarily.
Max memory usage (MMAPv1 only)
The mem.mapped metric, which is only available in the MMAPv1 storage engine, gives you a good approximation of the total size of your database(s).
Memory-mapped files are crucial for performance with the MMAPv1 storage engine since it allows MongoDB to manipulate data files as if they were in memory.
Data size per replica set
Monitoring the dataSize metric per replica set helps measure the space taken up by all the documents (plus padding with MMAPv1) in the database.
Set up real-time MongoDB monitoring in minutes with Datadog's out-of-the-box MongoDB dashboard.
Performance & error metrics
Oplog window per replica set
The oplog (operations log) window represents the interval of time between the oldest and latest entries in the oplog, which usually corresponds to the approximate amount of time available in the primary’s replication oplog. MongoDB advises that users send a warning notification if the oplog window is 25 percent below its usual value during traffic peaks, and a high-priority alert under 50 percent.
Max replication lag per replica set (seconds)
Replication lag represents how far a secondary is behind the primary for a replica set. Ideally, replication lag is equal to zero, which should be the case if you don’t have load issues.
If replication lag gets too high for all secondary nodes, the integrity of your data set might be compromised in case of failover (secondary member taking over as the new primary because the current primary is unavailable).
Number of open cursors per replica set
The number of cursors currently opened by MongoDB, which represent pointers to read query answers.
A gradual increase in the number of open cursors without a corresponding growth of traffic is often symptomatic of poorly indexed queries. It can also be the result of long running queries due to large result sets.
Number of timed out cursors per replica set
The cursor.timedOut metric is incremented when a client connection has died without having gracefully closed the cursor.
By default, MongoDB traps these cursors after 10 minutes of inactivity. You should check if you have a large amount of memory being consumed from non-active cursors. A high number of timed out cursors can be related to application issues.
Average duration of background flushes per replica set (seconds) (MMAPv1 only)
It is important to monitor this metric for the MMAPv1 storage engine. MongoDB “flushes” writes to data files every 60 seconds by default. This parameter can be tuned depending on the workload. If your background flushes take more than this frequency value to execute, it means that MongoDB is continuously flushing to disk, which can have a serious impact on your database performance. Your background flushes should usually take less than 1 second.
Number of asserts per second
Asserts typically represent errors. MongoDB generates a document reporting on the number of each type of assertions that have been raised: message, warning, regular, and user. This metric monitors the total number of asserts per second.
See your metrics in minutes with our MongoDB dashboard
If you’d like to start visualizing your MongoDB metrics in our out-of-the-box dashboard, you can try Datadog for free. The MongoDB dashboard will be populated immediately after you set up the MongoDB integration.
For a deep dive on MongoDB metrics and how to monitor them, check out our three-part MongoDB monitoring series.