Istio dashboard overview
A healthy Istio cluster can manage traffic across thousands of service pods. But a misconfiguration or loss of istiod availability can cause unexpected behavior in your mesh. Datadog’s Istio integration helps you ensure that your cluster’s core components have adequate resources and function as expected, and that the services Istio manages are handling appropriate levels of work.
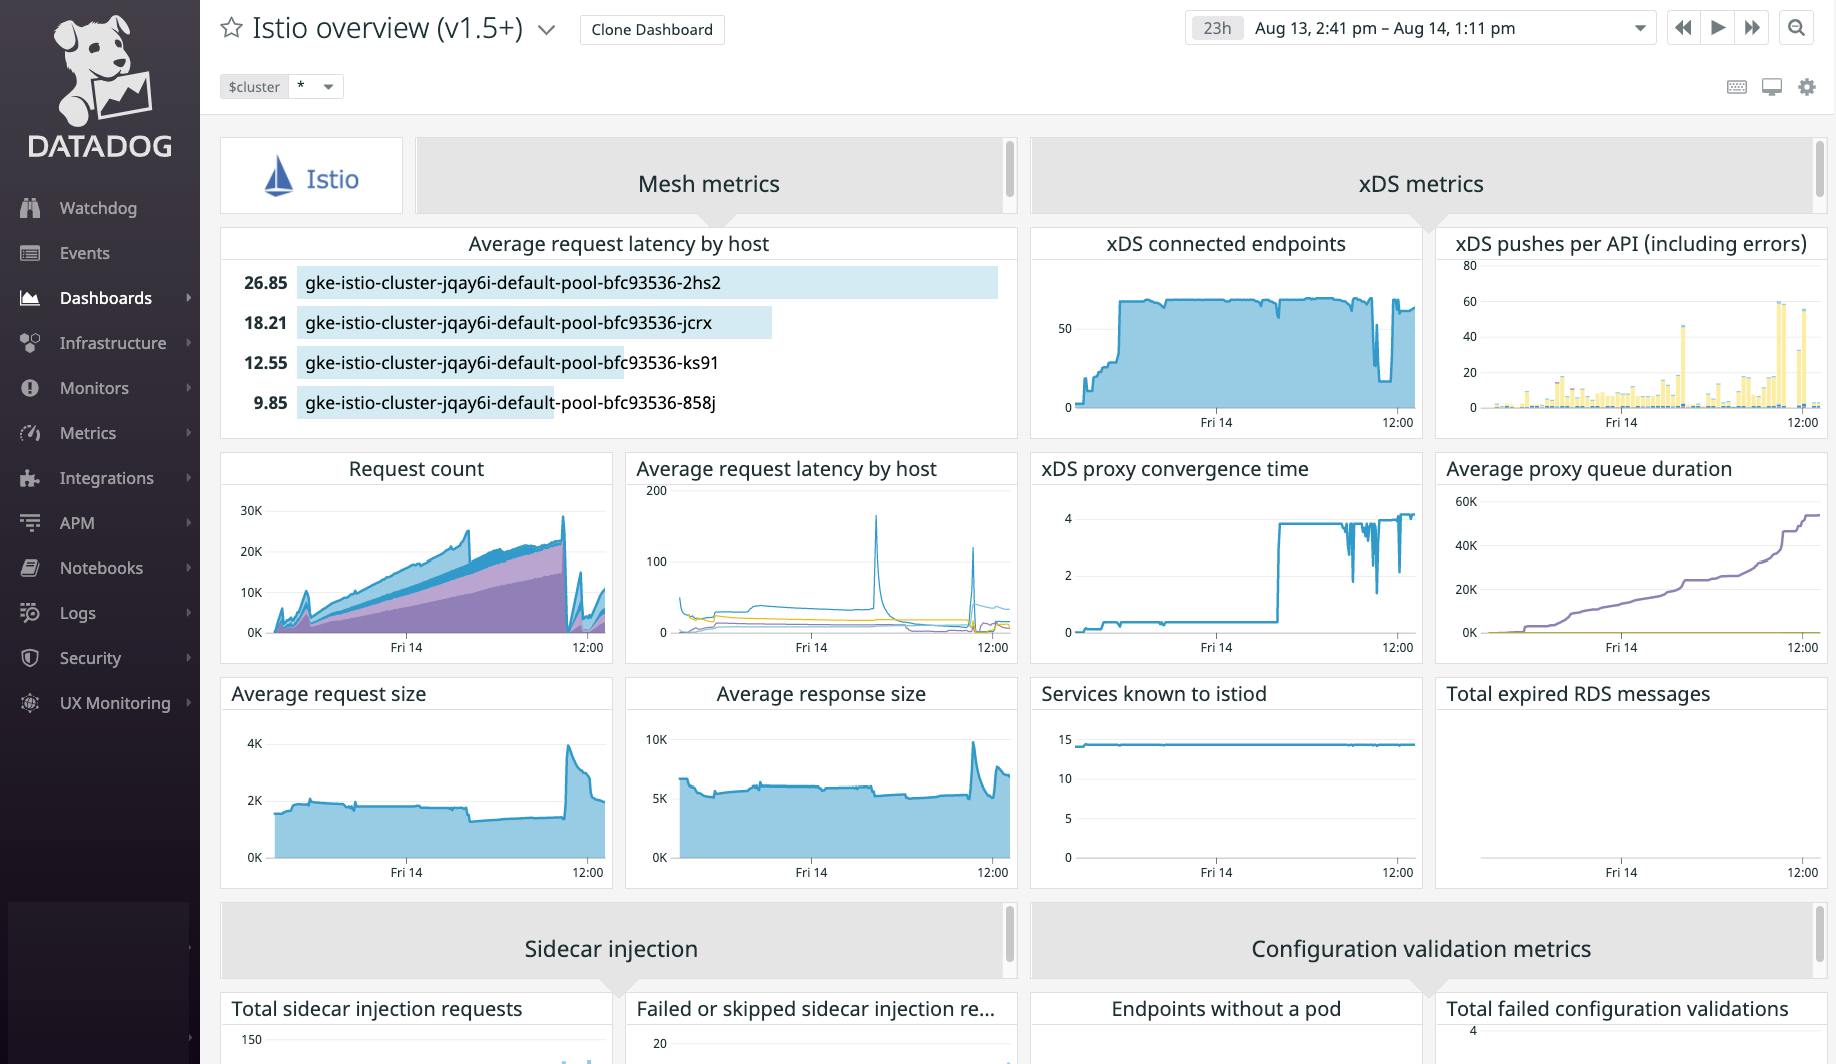
Datadog’s comprehensive Istio dashboard enables you to track istiod, as well as the services it manages, within a single view. This page explains the metrics included in the dashboard to help you get started monitoring Istio. (Datadog also provides a separate dashboard for versions of Istio prior to 1.5.0.)
What is Istio?
Istio is an open source service mesh that makes it easier to manage traffic in distributed systems on Kubernetes. In versions 1.5.0 and later, a component called istiod deploys Envoy proxies as sidecars into your application pods. The sidecars route service-to-service traffic based on configurations that istiod sends them, meaning that users can manage their network architecture without editing application code.
Istio dashboard metrics breakdown
Mesh metrics
Average request latency by host (toplist)
The Datadog Agent collects Istio’s mesh metrics directly from local Envoy containers. Request latency is broken down by host, so you can see which nodes in your Istio cluster may be facing performance bottlenecks, detect possible resource saturation issues, and set more intelligent resource limits for your service pods. This toplist shows you immediately which hosts you may need to look into further.
Request count
The number of requests handled by all proxies in your Kubernetes cluster, grouped by node. You can use this graph to get a sense of the overall volume of traffic that your Istio deployment manages. Unexpected drops in traffic can indicate misconfigurations and—if they’re on a particular host—node-level resource issues.
Average request latency by host (timeseries graph)
If you’ve identified an underperforming host using the request latency toplist, you can use this timeseries graph to see how long the proxies running on that host have been sustaining latency issues.
Average request size
The average size in bytes of HTTP request bodies within your mesh. If increases in this metric correlate with poor performance or high resource utilization among application pods in your mesh, consider breaking up your request payloads or applying rate limiting.
Average response size
Tracks the average size in bytes of HTTP response bodies within your mesh. Sudden drops can indicate recent failures in your applications or their dependencies—even if your APIs are returning 200 (OK) response codes.
xDS metrics
xDS connected endpoints
The number of Envoy proxies currently connected to istiod’s xDS server, which implements Envoy’s configuration APIs. More proxies mean more load on the xDS server, so make sure that any increases in this metric don’t correlate with CPU or memory saturation within istiod.
xDS pushes per API (including errors)
This xDS throughput metric counts the number of configuration pushes on each of the xDS APIs (LDS, EDS, RDS, and CDS), including errors in sending or building xDS messages. (Note that as of version 1.6.0, this metric no longer tracks errors in building xDS messages.) Use the type tag to break down this metric by xDS API or error type.
xDS proxy convergence time
The duration (in milliseconds) of configuration pushes to Envoy proxies in your mesh. If high values of this metric correspond with application traffic issues, consider applying fewer new Istio configurations at once or scaling istiod.
Average proxy queue duration
When istiod pushes configurations to xDS clients, it queues each pending request. This graph tracks the average time (in seconds) that each request spends in the queue before istiod can process it, plus the sum and count of this metric. The count provides visibility into the amount of work the xDS server is currently performing, since this metric is recorded whenever a request is dequeued.
Services known to istiod
The number of services that istiod has registered in memory. Changes in this metric can also explain other service discovery metrics like the number of xDS pushes and errors.
Total expired RDS messages
Envoy’s Route Discovery Service (RDS) sends and receives configurations for collections of virtual hosts known as routes. For RDS, istiod implements Envoy’s system of using nonces to associate sequences of requests for configuration data. This metric increments when istiod receives an xDS DiscoveryRequest that is out of date.
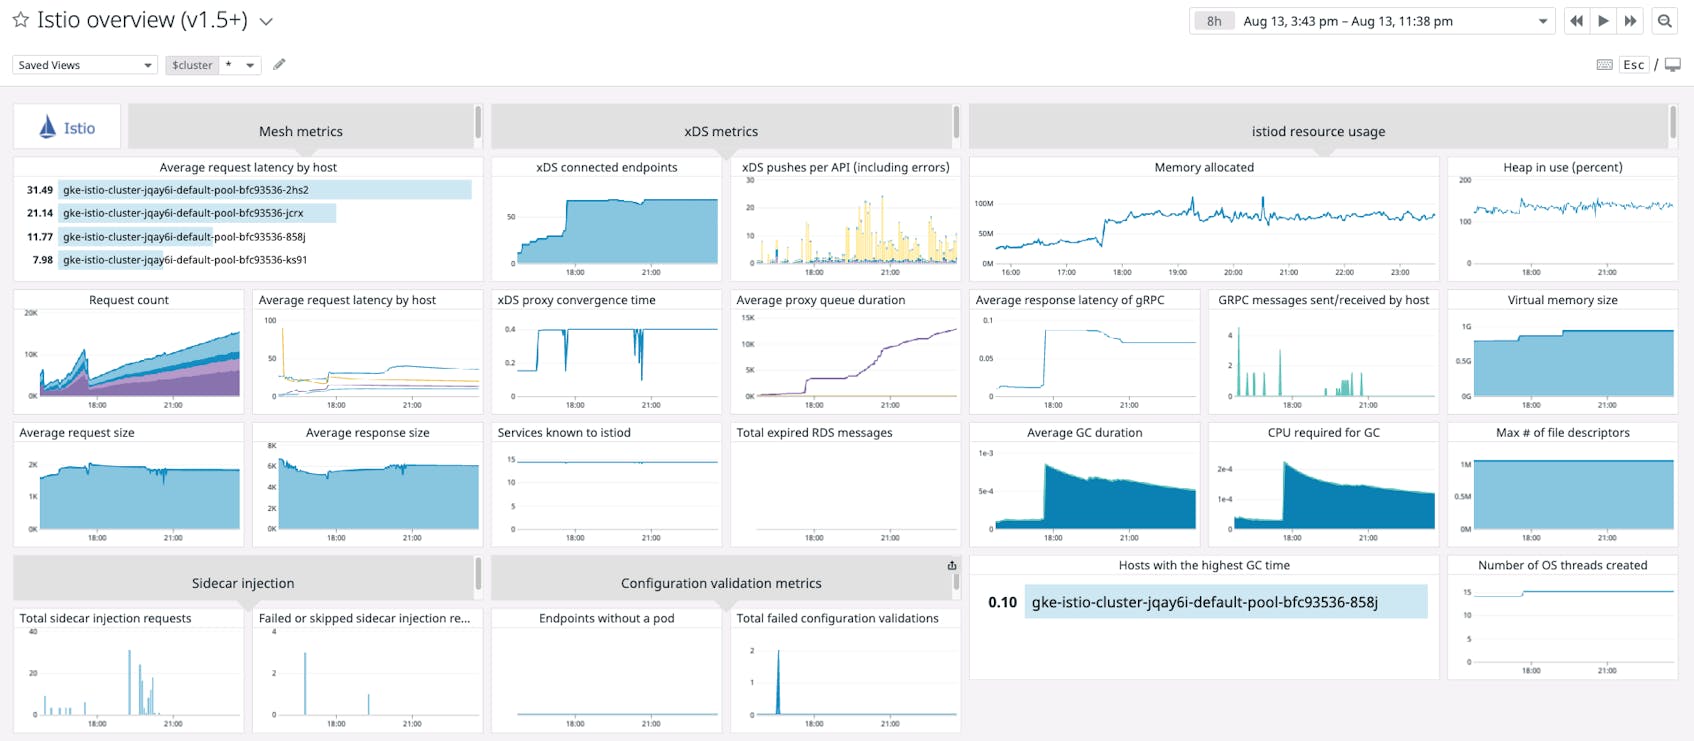
Istiod resource usage metrics
Memory allocated
Tracks the highest number of bytes that the istiod process has allocated in memory across the evaluation period, for all instances of istiod. You can compare this metric to the number of Kubernetes pods running istiod to determine whether you should scale your istiod deployment. In particular, see if massive allocations correlate with increases in work metrics elsewhere on the dashboard, such as xDS pushes.
Heap in use (percent)
The Golang runtime caches virtual memory allocations within a page heap. If there is not enough memory available in the heap to accommodate a new allocation, the runtime executes a system call (brk). Since system calls can be the most performance-intensive part of a Golang application, a saturated page heap will slow down your istiod deployment.
Average response latency of gRPC
This graph shows three gRPC metrics: the total time (in seconds) the server spent processing requests, the number of gRPC requests the server processed, and the average time (in seconds) the server spent processing each request. These metrics can help you track the performance of istiod, which uses gRPC for its xDS server and certificate authority.
gRPC messages sent/received by host
Hosts with the highest number of gRPC messages sent and received during the evaluation window, tracked separately as stacked areas. Since istiod relies heavily on gRPC, this is a good measure of the work istiod is doing in your mesh.
Virtual memory size
The amount of virtual memory the istiod process is currently consuming (as reported by the /proc/<pid>/stat pseudo-file), giving you more context around istiod’s resource utilization.
Average GC duration
The average time (in seconds) it takes for the istiod process to complete the Golang runtime’s garbage collection sequence. Slow garbage collection can delay program execution.
CPU required for GC
The Golang runtime’s scheduler assigns each goroutine to an abstract representation of a virtual core called a logical processor. During garbage collection, the collector uses a portion of these logical processors. If high CPU utilization is an issue for your istiod pods, you can see how much this metric contributes and consider tuning istiod’s garbage collection.
Max # of file descriptors
The highest number of file descriptors that the istiod process can use (as shown in /proc/<pid>/limits). Investigate if this metric is coming close to your system’s file descriptor limit to avoid “too many open files” errors.
Hosts with the highest GC time
If you’re running multiple instances of istiod and are investigating high memory usage, this graph indicates which hosts you should prioritize, i.e., which hosts take the most time to complete a garbage collection cycle.
Number of OS threads created
Tracks the highest number of CPU threads that the istiod process has used. This is one way to measure Istio’s CPU utilization.
Sidecar injection metrics
Total sidecar injection requests
The number of requests to istiod’s sidecar injection webhook, which deploys Envoy proxies within newly created application pods. The Kubernetes API server makes a request to the webhook every time you create a pod within your cluster, unless you’ve configured Istio to skip sidecar injection for that pod’s deployment.
Failed or skipped sidecar injection requests
The number of errors istiod’s sidecar injection webhook has encountered while processing requests. This can help you diagnose unexpected networking issues among your Istio-managed services.
Configuration validation metrics
Endpoints without a pod
When gathering endpoint information from Kubernetes, istiod needs to build up an in-memory store of current endpoints. This metric indicates the number of endpoints that do not have an associated Kubernetes pod. Use this to troubleshoot issues with Istio’s Endpoint Discovery Service.
Total failed configuration validations
The number of times istiod’s configuration validation webhook has rejected a request. To see why validations have failed, you can group this graph by the reason label. Note that the Kubernetes API server will also validate configurations, and can reject requests before they reach the validation webhook.
Monitor Istio in minutes
If you’d like to start visualizing your Istio metrics in Datadog’s out-of-the-box dashboard, sign up for a free trial. You’ll see data in your Istio dashboard within minutes of setting up the Istio integration. For a deeper dive into monitoring Istio, check out our guide.