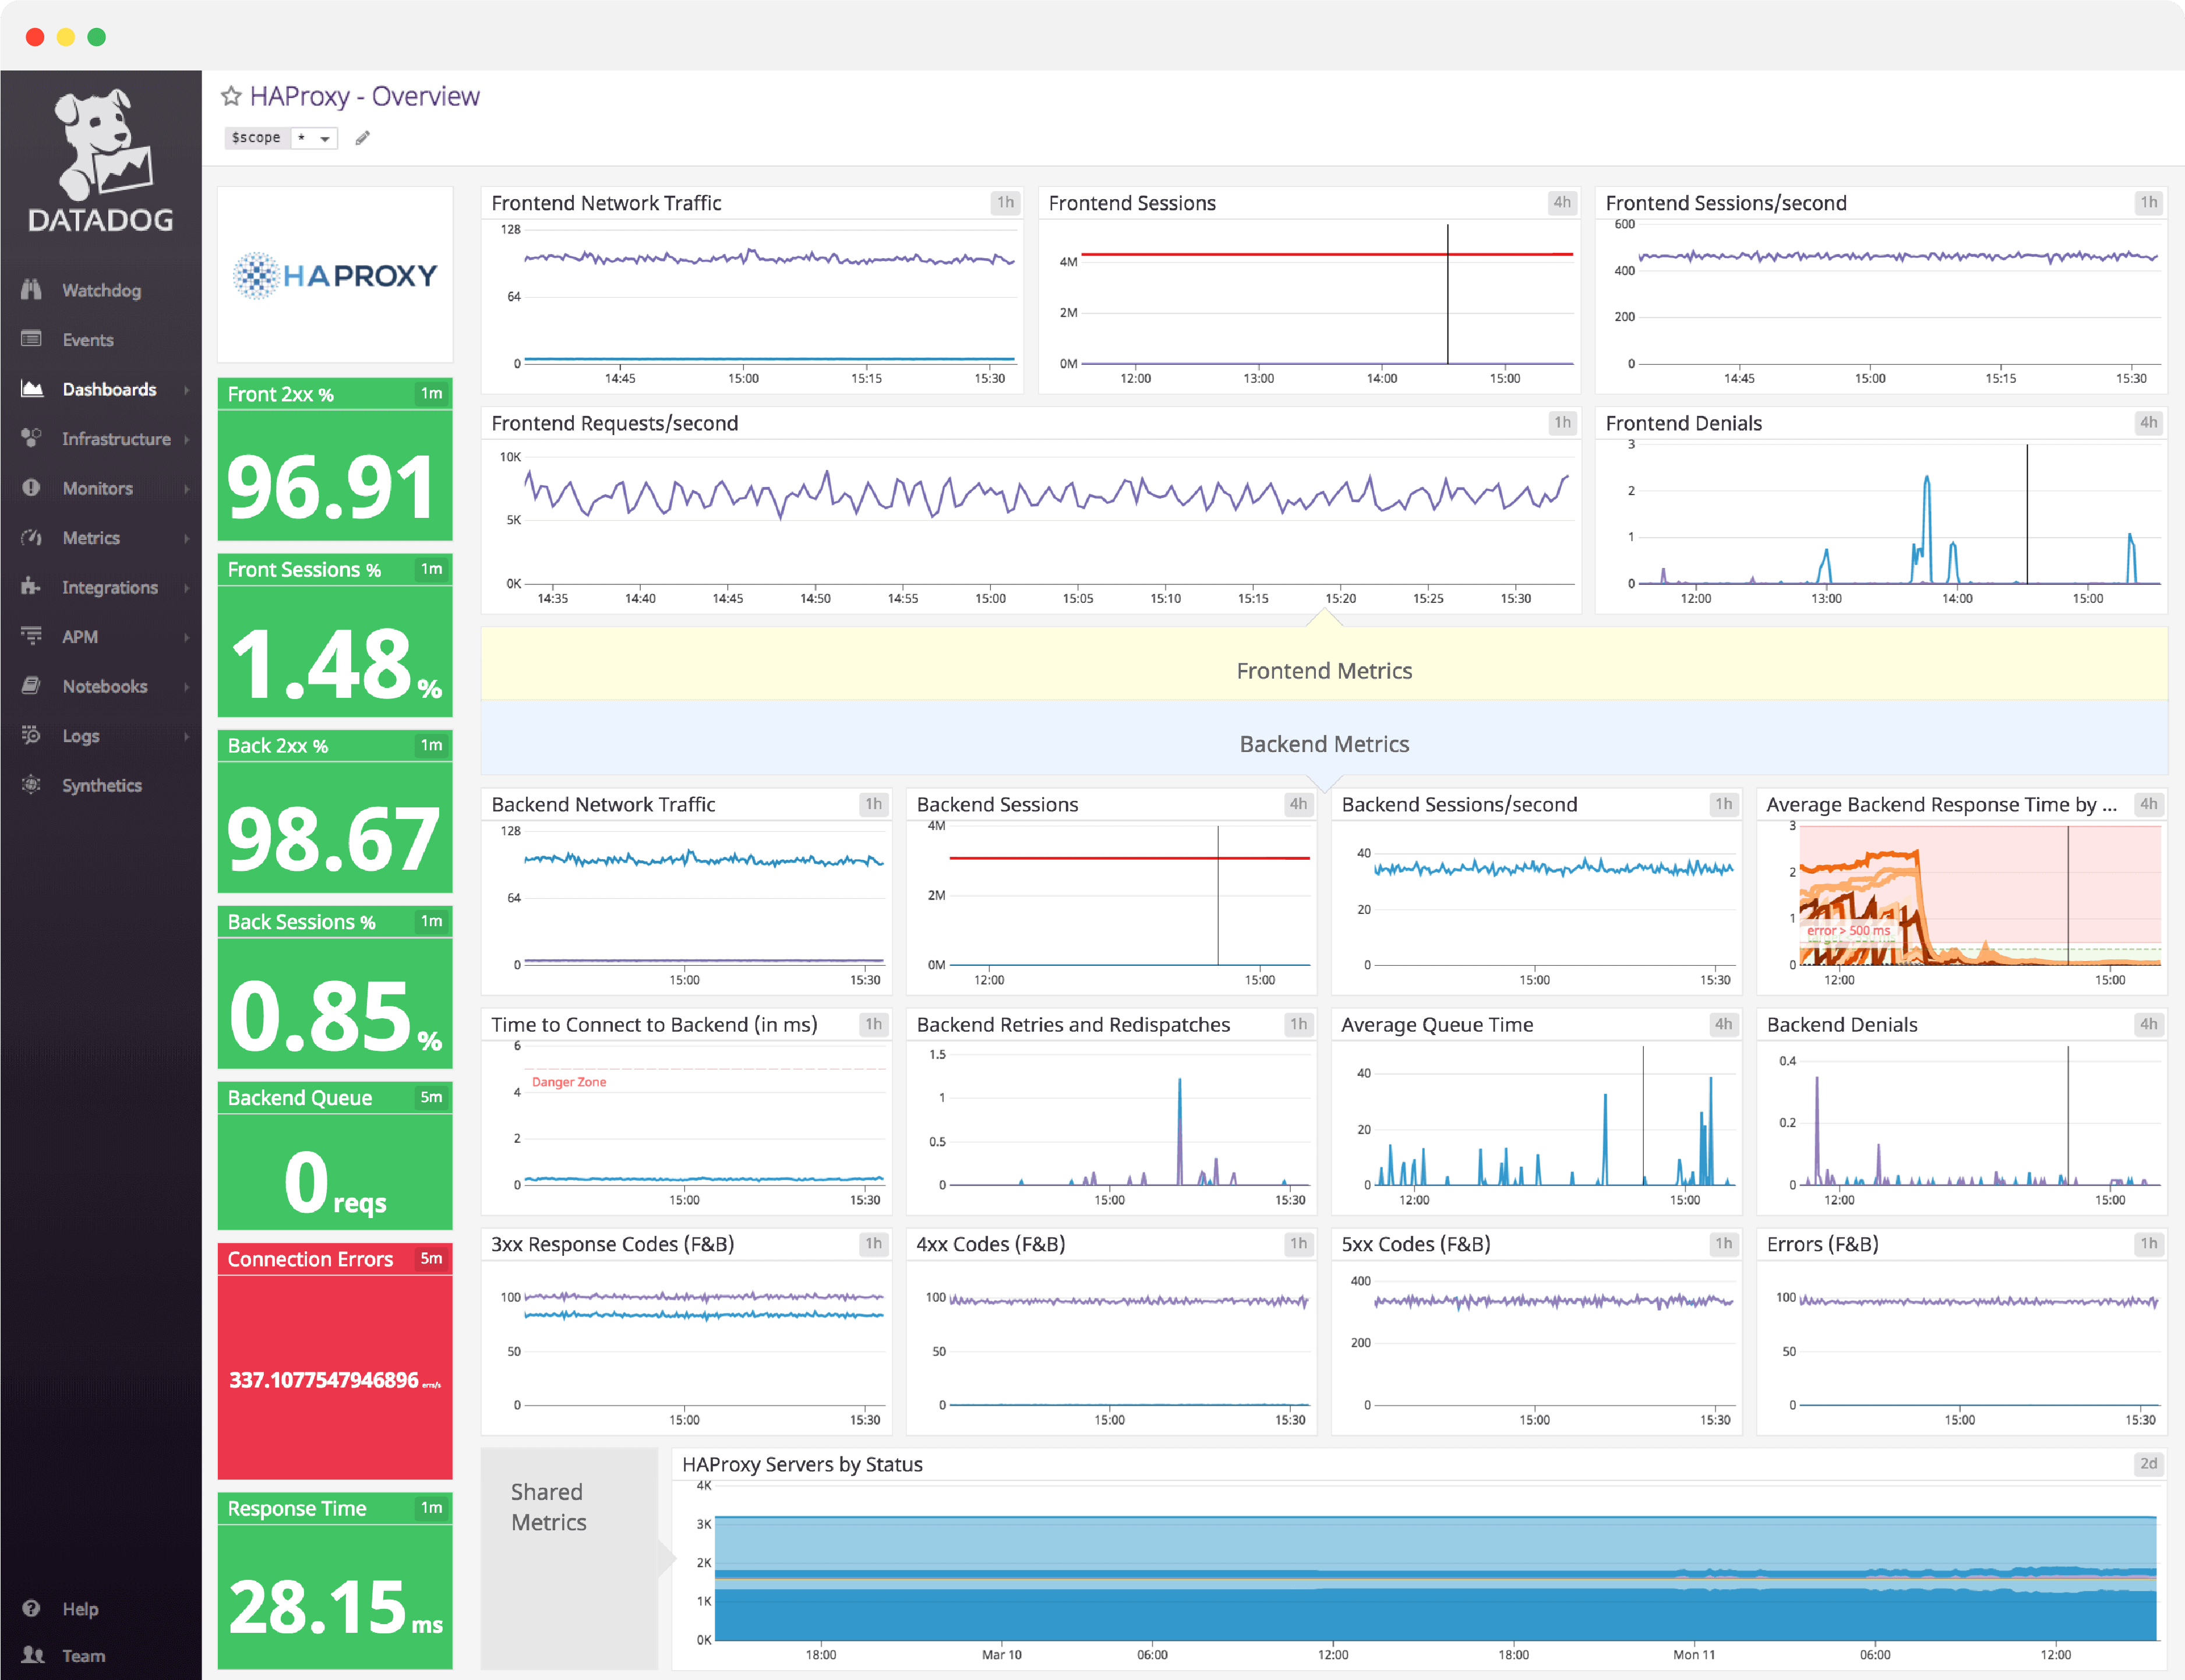
HAProxy dashboard overview
Because a load balancer is the intermediary between client connections and the backend, a misconfigured HAProxy setup will slow everything down. Thus, it is important to monitor frontend connections between the client and HAProxy, connections between HAProxy and your backend servers, and combined metrics such as error codes and server status.
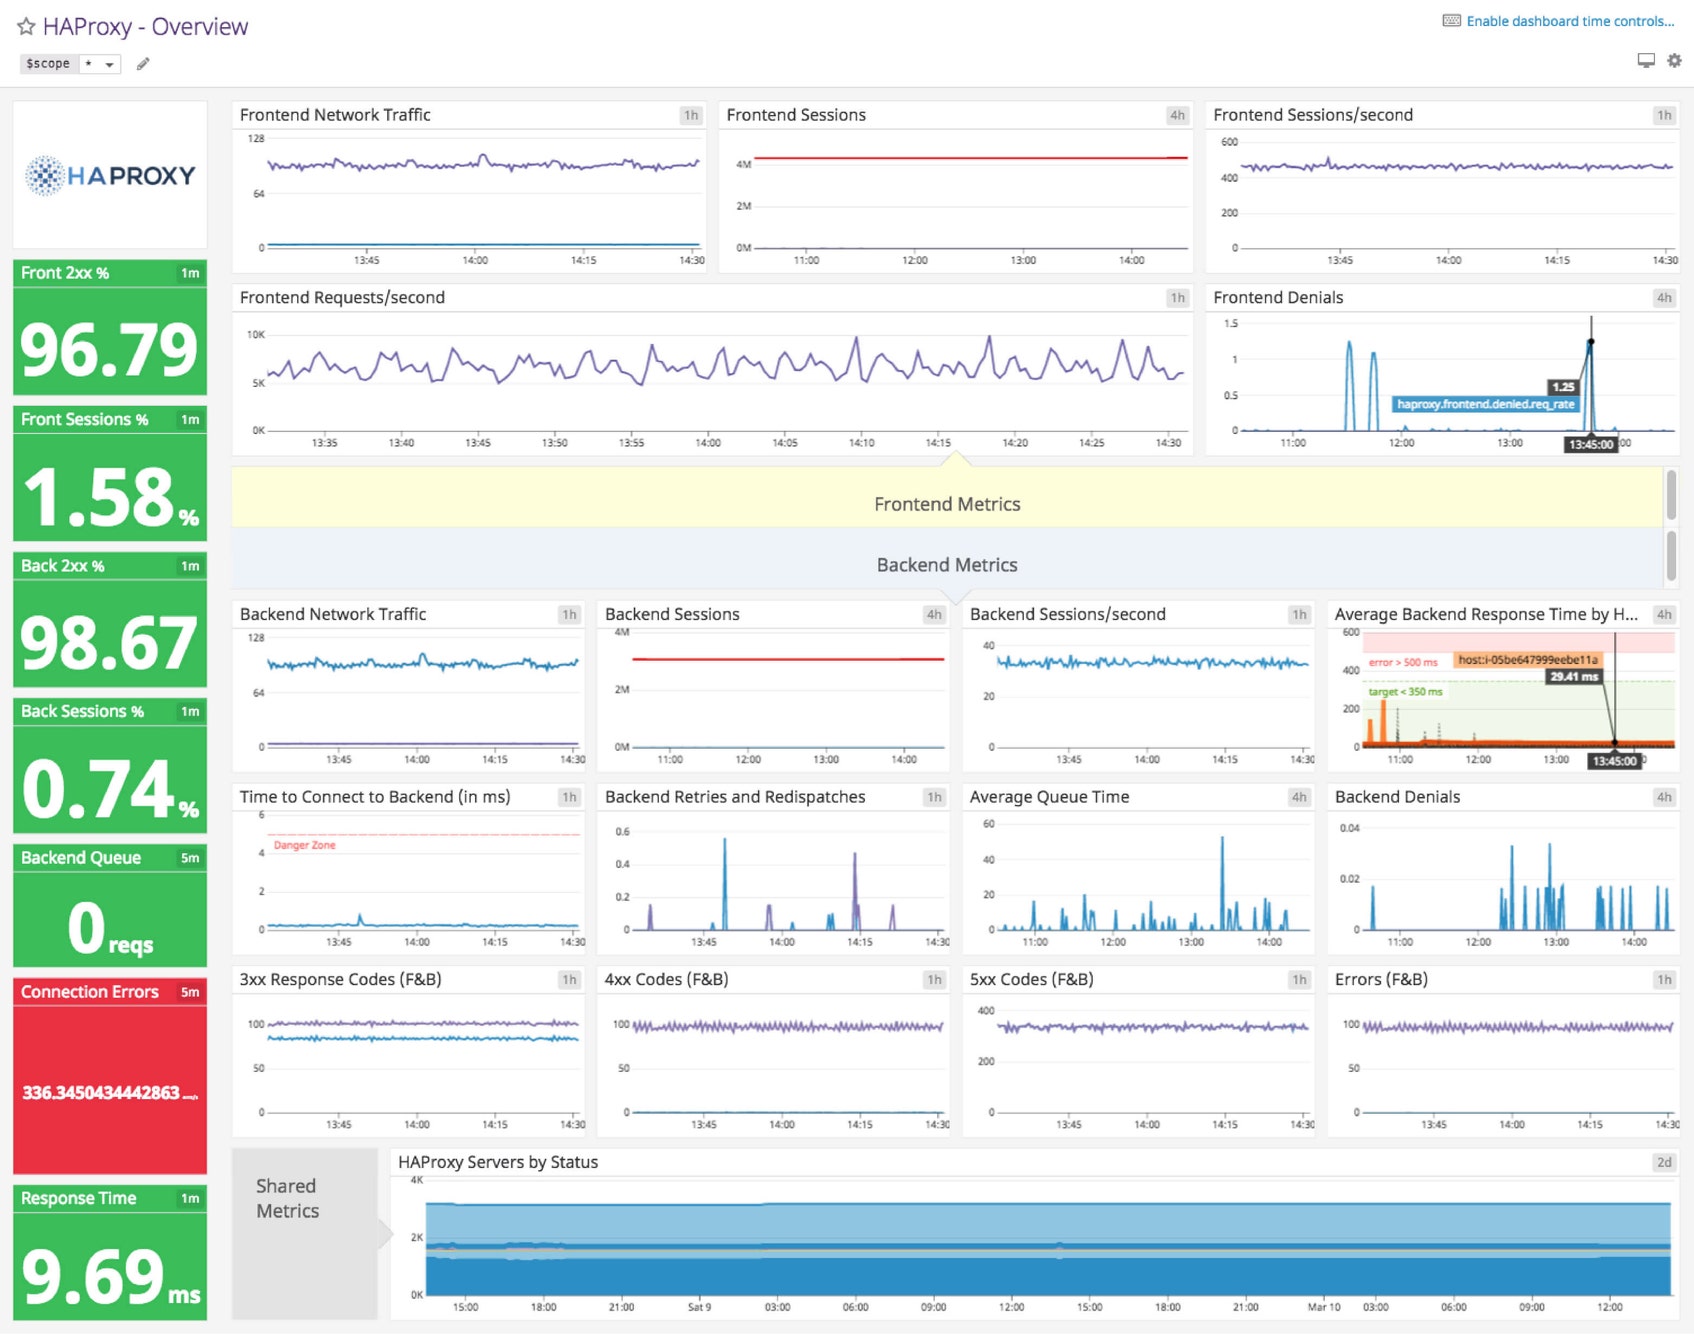
Datadog’s comprehensive HAProxy dashboard displays important frontend, backend, and combined metrics in a single pane of glass. This page breaks down the metrics featured on that dashboard to provide a starting point for anyone looking to monitor HAProxy performance.
What is HAProxy?
HAProxy is an open source solution for load balancing and reverse proxying TCP and HTTP requests. It is a robust, high-availability platform that can route around and remove backends that fail its built-in health checks. HAProxy is a keystone of some extremely well-known, high-traffic sites, including Twitter, Instagram, Tumblr, Reddit, and Yelp.
See real-time HAProxy data in minutes with Datadog's out-of-the-box HAProxy dashboard.
HAProxy dashboard metrics breakdown
Frontend metrics
Front 2xx %
The percentage of responses that are successful.
Front sessions %
Indicates the number of frontend sessions (from clients to HAProxy), as a percentage of HAProxy’s total capacity. If the number of frontend sessions is well over 80% of capacity, you might want to increase the session cap, migrate your HAProxy server to a bigger box, or add another HAProxy server to the pool.
Frontend network traffic
The volume of network traffic, over time, expressed as a rate (e.g., mebibytes per second).
Frontend sessions
HAProxy defines a session as being composed of two connections, one from the client to HAProxy, and the other from HAProxy to the appropriate backend server. Thus, frontend sessions represent the number of clients that are connected to HAProxy.
Frontend sessions/second
The number of new connections made per second, from clients to HAProxy. HAProxy allows you to cap the number of new sessions per second in order to keep your deployment from creaking under the weight of new visitors.
Frontend requests/second
Once a session has been created, clients can begin to issue requests. All of a client’s requests are usually contained within a single session. This metric measures the number of HTTP requests received per second.
Frontend denials
Frontend denials track the number of requests that are denied because they fail to pass security restrictions.
Backend metrics
Back 2xx %
The number of successful responses from the backend, expressed as a percentage of the total.
Back sessions %
Indicates the number of backend sessions (from HAProxy to your backend servers), as a percent of HAProxy’s total capacity.
Backend queue
Current number of queued requests awaiting assignment to a backend server. If your backend is bombarded with connections to the point where you have reached your global maxconn limit, HAProxy will seamlessly queue new connections in your system kernel’s socket queue until a backend server becomes available, or a timeout is reached.
Connection errors
This metric indicates failed backend requests and general backend errors. To hunt down the cause of backend errors, correlate this metric with response codes from your frontend and backend servers.
Backend network traffic
The volume of network traffic being served by the backend over time, expressed as a rate (e.g., mebibytes per second).
Backend sessions
The number of connections from HAProxy to a backend server at any given time. Even if HAProxy reaches its connection limit, the application will continue to accept and queue connections until the backend server fails.
Backend sessions/second
The number of connections from HAProxy to backend servers, per second.
Average backend response time by host (ms)
Response time represents the average response time over a sliding window of the last 1,024 requests. Keep in mind that this metric will be zero if you are not using HTTP mode. Response times over 500 milliseconds typically result in degradation of application performance and customer experience. Watch this closely.
Time to connect to backend (ms)
The time it takes for HAProxy to connect to a backend server.
Backend retries and redispatches
The number of retries, plus the number of times a request was redispatched to a different backend. When the retry metric creeps above the normal baseline, expect a spike in errors and connection failures.
Average queue time (ms)
Average time spent in queue for the last 1,024 requests. Since this is an average, the overall result can be skewed by a single request trapped in queue. Keep this value as low as possible.
Backend denials
Most denials will originate in the frontend, but sometimes, a backend denial can occur when a benign request produces a response that contains sensitive information. If you see a rise in this metric, you may want to set up an Access Control List (ACL), which denies the offending responses and throws a 502 error code.
See real-time HAProxy data in minutes with Datadog's out-of-the-box HAProxy dashboard.
Shared metrics (frontend and backend)
3xx response codes (F&B)
The number of 3xx response codes, which indicate that the client has taken more than one action to complete a request. This is usually due to some kind of URL redirection.
4xx response codes (F&B)
This represents the number of client error codes. Code 408 tends to crop up when browsers pre-connect and timeout, whereas code 404 could point to a misconfigured application or unruly client.
5xx response codes (F&B)
The number of HTTP server errors. These are usually correlated with a large number of denied responses.
Errors (F&B)
The combined number of errors, including all HTTP response codes, from both the frontend and the backend.
HAProxy servers by status
Once set up, HAProxy can regularly perform health checks on all enabled servers. If a health check fails three times in a row (configurable with the rise directive), it is marked in a DOWN state. Monitoring the health of your HAProxy servers gives you the information you need to quickly respond to outages as they occur.
Monitor frontend connections and backend servers with our HAProxy dashboard
If you’d like to start visualizing your HAProxy metrics in our out-of-the-box dashboard, you can try Datadog for free. The HAProxy dashboard will be populated immediately after you set up the HAProxy integration.
For a deep dive on HAProxy metrics and how to monitor them, check out our three-part How to Monitor HAProxy series.