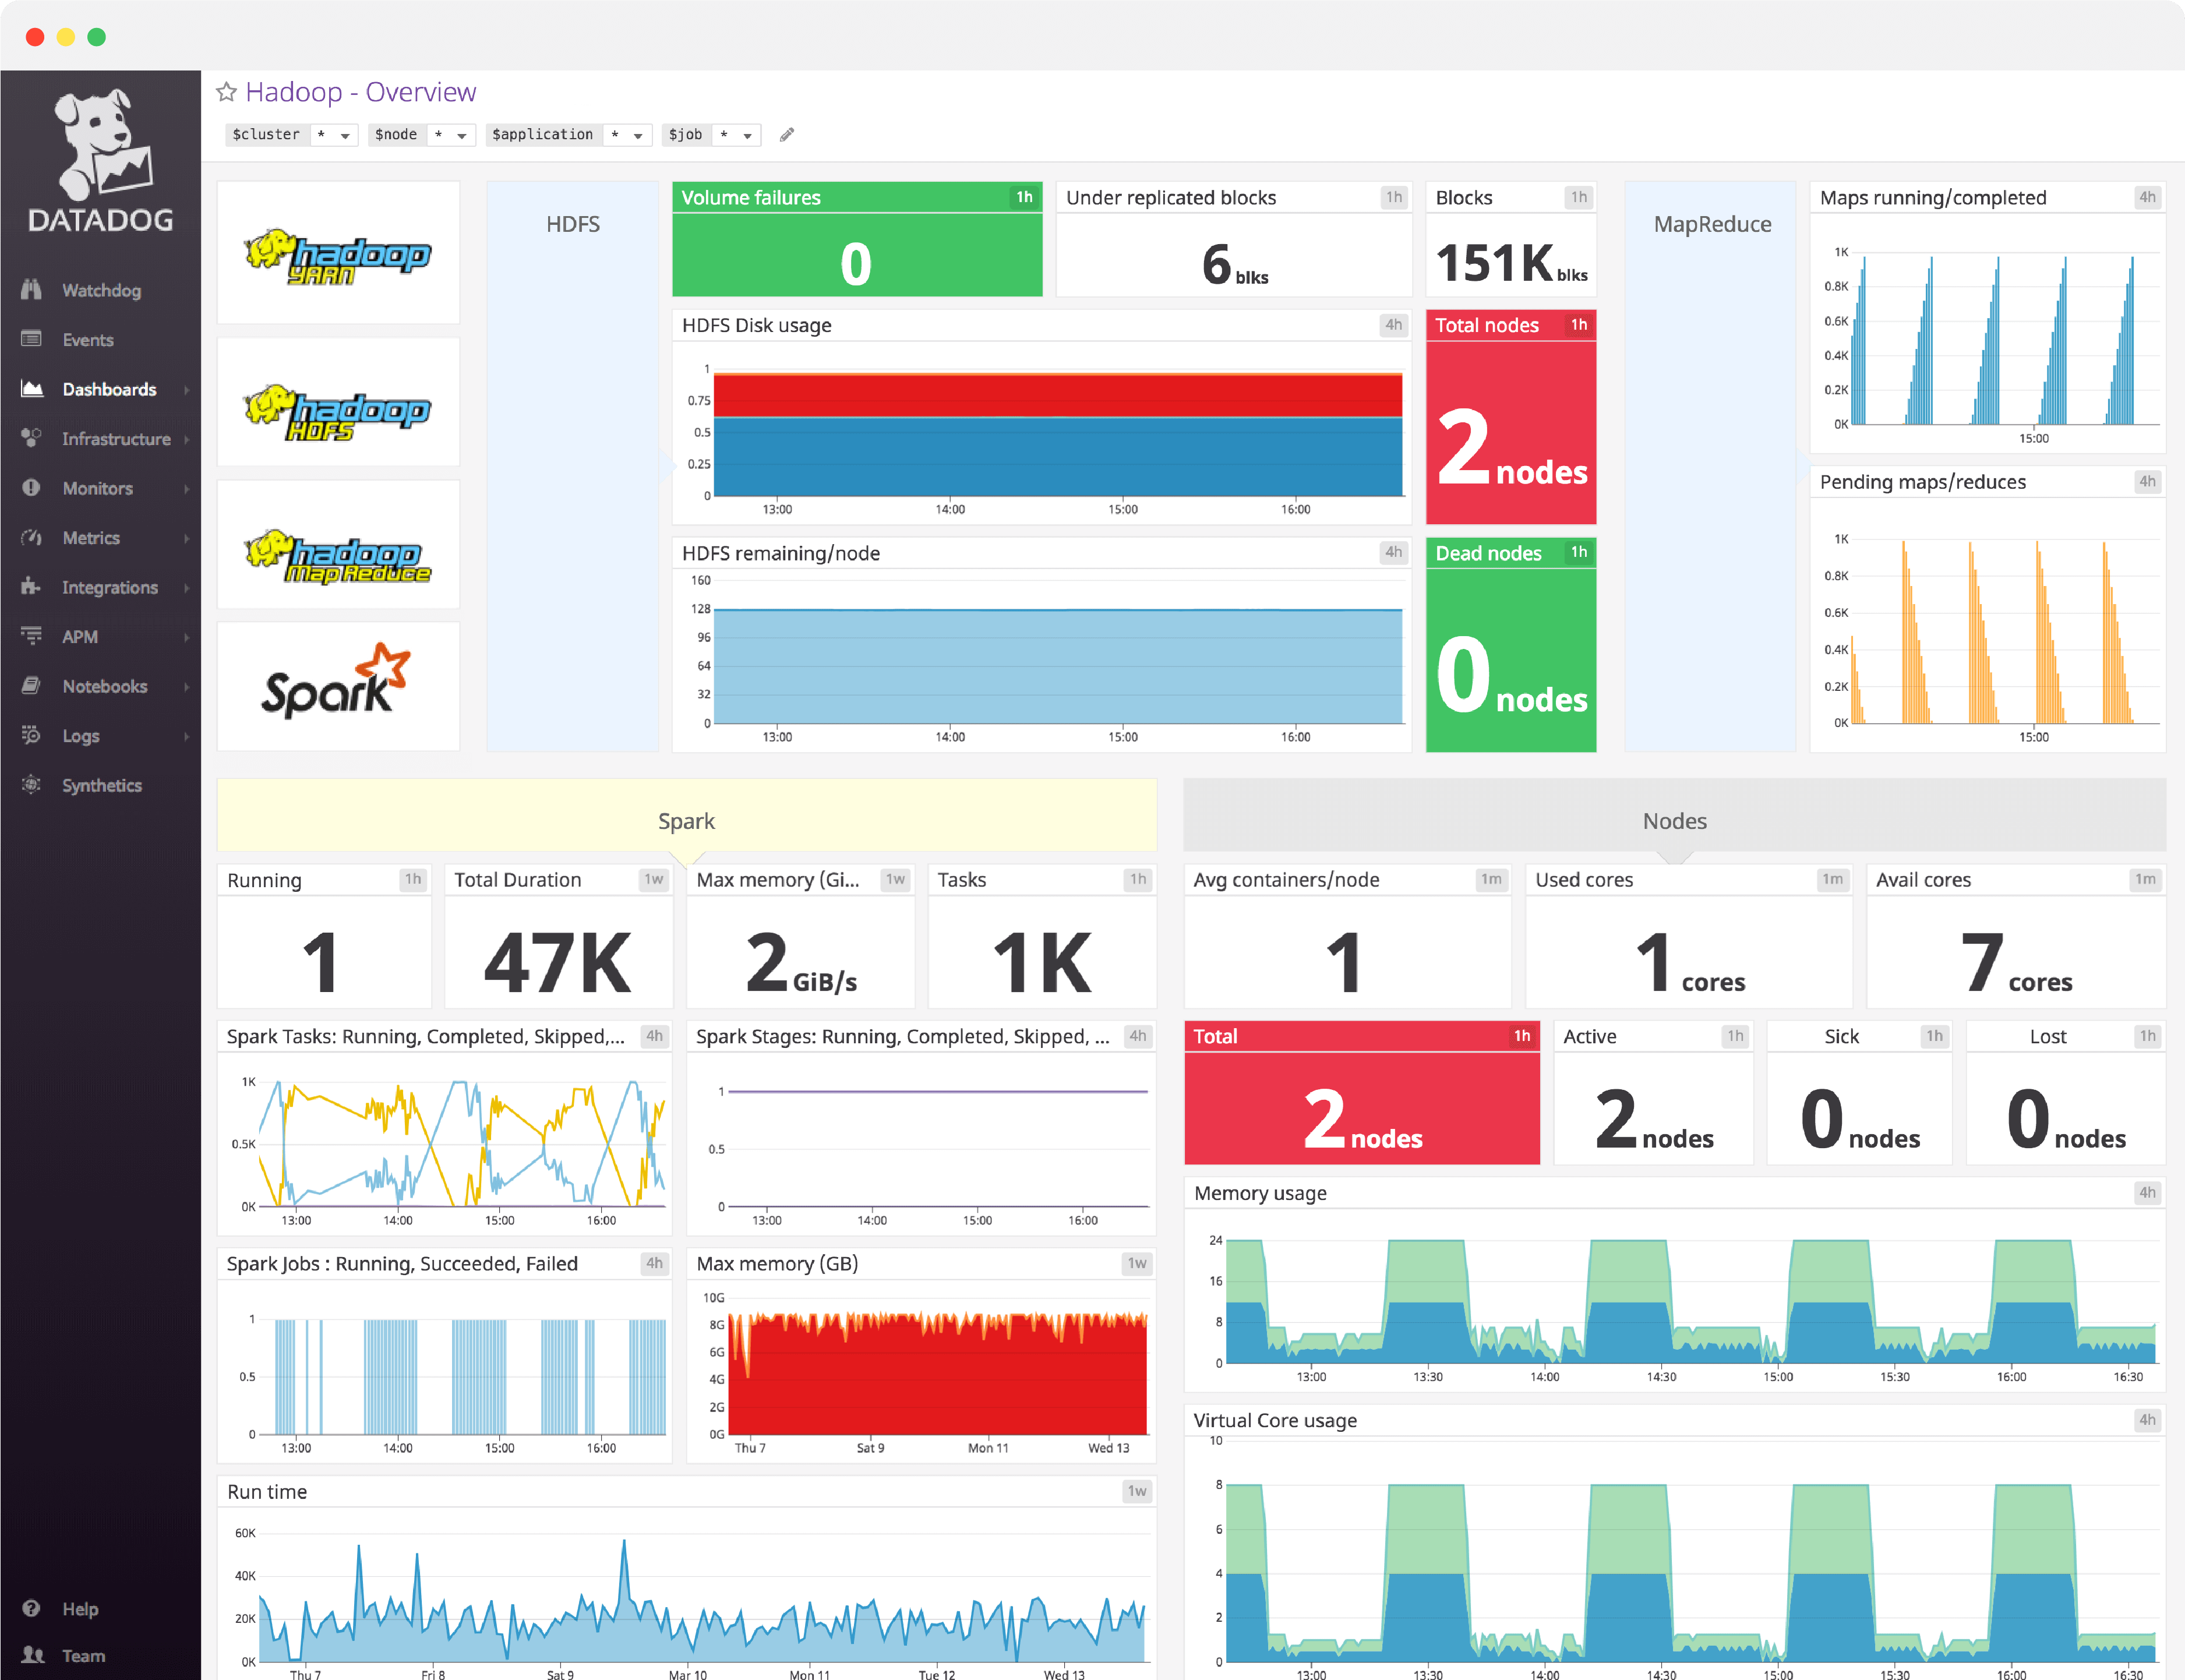
Hadoop dashboard overview
When working properly, a Hadoop cluster can handle a truly massive amount of data — there are plenty of production clusters managing petabytes of data each. Monitoring each of Hadoop’s subcomponents — HDFS, MapReduce and YARN—is essential to keeping jobs running and the cluster humming.
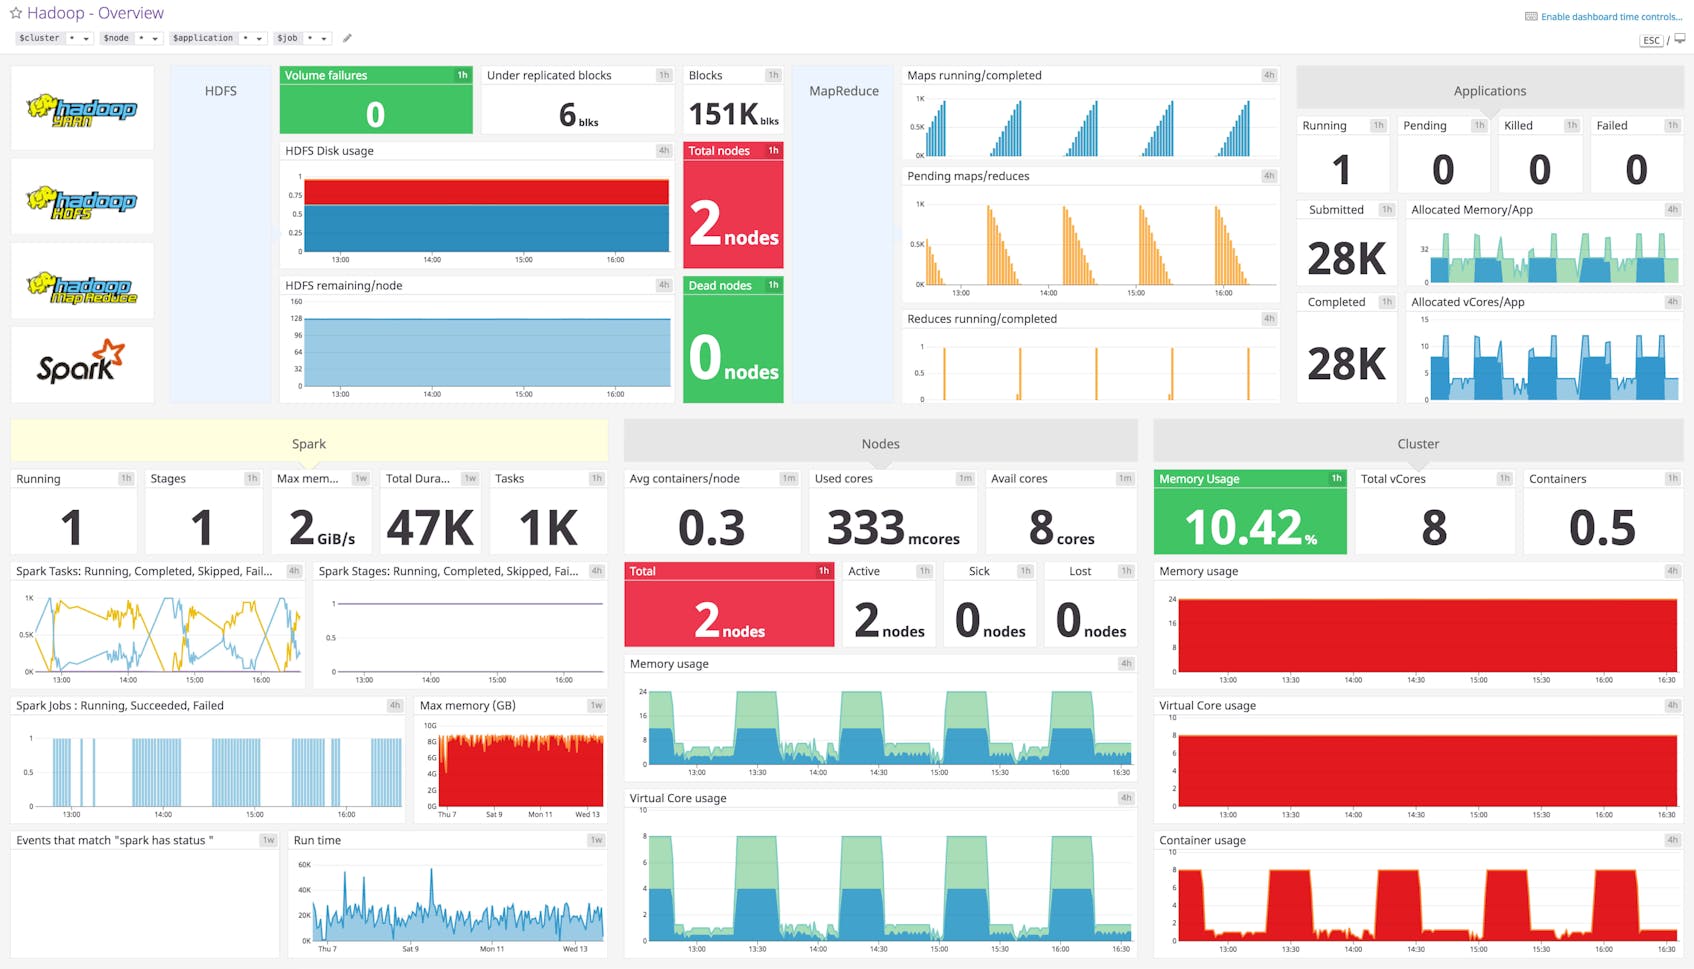
Datadog’s comprehensive Hadoop dashboard displays key pieces of data to monitor for each subcomponent in a single pane of glass. This page breaks down the metrics featured on that dashboard to provide a starting point for anyone looking to monitor Hadoop.
What is Hadoop?
Apache Hadoop is an open source framework for distributed storage and processing of very large data sets on computer clusters.
Hadoop began as a project to implement Google’s MapReduce programming model, and has become synonymous with a rich ecosystem of related technologies, not limited to: Apache Pig, Apache Hive, Apache Spark, Apache HBase.
Set up real-time Hadoop monitoring in minutes with Datadog's out-of-the-box Hadoop dashboard.
Hadoop dashboard metrics breakdown
HDFS metrics
The Hadoop Distributed File System (HDFS) is the underlying file system of a Hadoop cluster. It provides scalable, fault-tolerant, rack-aware data storage designed to be deployed on commodity hardware.
Total nodes
The number of alive data nodes in your cluster. Ideally this number will be equal to the number of DataNodes you’ve provisioned for the cluster.
Dead nodes
The number of dead data nodes in your cluster. It is important to alert on the NumDeadDataNodes metric because the death of a DataNode causes a flurry of network activity, as the NameNode initiates replication of blocks lost on the dead nodes.
Losing multiple DataNodes will start to be very taxing on cluster resources, and could result in data loss.
Volume failures
This monitors the number of failed volumes in your Hadoop cluster. Though a failed volume will not bring your cluster to a grinding halt, you most likely want to know when hardware failures occur, if only so that you can replace the failed hardware.
Total blocks
HDFS split large files into manageable pieces known as blocks. Tracking the total number of blocks across the cluster is essential to continued operation.
Under replicated blocks
The the number of blocks with an insufficient number of replicas. If you see a large, sudden spike in the number of under-replicated blocks, it is likely that a DataNode has died — this can be verified by correlating under-replicated block metric values with the status of DataNodes.
HDFS disk usage
This metric tracks the total disk usage across the entire HDFS cluster.
HDFS remaining/node
The disk space remaining for a particular DataNode. If left unrectified, a single DataNode running out of space could quickly cascade into failures across the entire cluster as data is written to an increasingly-shrinking pool of available DataNodes.
See your real-time Hadoop data in minutes with Datadog's out-of-the-box Hadoop dashboard.
YARN metrics
YARN (Yet Another Resource Negotiator) is the framework responsible for assigning computational resources for application execution. The YARN metrics below provide information on the execution of individual applications as well as the cluster and node level.
YARN application metrics
Progress
Progress gives you a real-time window into the execution of a YARN application. Because application execution can often be opaque when running hundreds of applications on thousands of nodes, tracking progress alongside other metrics can better help you to determine the cause of any performance degradation.
Tracking a particular execution status, such as submitted, running, done, pending, killed and failed, offers context that can help clarify progress metric values. Applications that go extended periods without making progress should be investigated.
Allocated memory/app
This is a high-level view of the amount of RAM allocated per application.
Allocated vCores/app
This is the number of virtual cores allocated per application.
YARN cluster metrics
Memory usage
By tracking the combination of the totalMB and allocatedMB metrics you can gain a high-level view of your cluster’s memory usage. Keep in mind that YARN may over-commit resources, which can occasionally translate to reported values of allocatedMB which are higher than totalMB.
Total vCores
The total number of virtual cores in the cluster.
Containers
The number of containers in the cluster, where containers represent a collection of physical resources—an abstraction used to bundle resources into distinct, allocatable units.
Virtual core usage
This metric tracks the virtual core usage across the cluster.
Container usage
The total number of containers allocated, aggregated by cluster.
YARN node metrics
Active
The number of currently active nodes. These are the normally operating nodes given by the activeNodes metric.
Sick
This indicates the unhealthy nodes in the cluster. YARN considers any node with disk utilization exceeding the value specified under the property yarn.nodemanager.disk-health-checker.max-disk-utilization-per-disk-percentage to be unhealthy.
Rebooted
The number of nodes in the cluster that have rebooted.
Lost
If a NodeManager fails to maintain contact with the ResourceManager, it will eventually be marked as “lost” and its resources will become unavailable for allocation. This tracks the lostNodes metric.
Avg containers/node
This tracks the average number of containers running per host.
See your real-time Hadoop data in minutes with Datadog's out-of-the-box Hadoop dashboard.
Memory usage
This monitors the memory in use broken down by node.
Virtual core usage
This metric measures the virtual core usage of each node.
MapReduce metrics
The MapReduce framework exposes a number of statistics to track on MapReduce job execution. These metrics can provide and invaluable mechanism that lets you see what is actually happening during a MapReduce job run.
Maps running/completed
The number of maps that are running and have successfully run on the cluster.
Pending maps/reduces
The number of maps and reduces that are queued for processing.
Reduces running/completed
The volume of reduce tasks that are running, and that have successfully run on the cluster.
Configure a Hadoop dashboard in minutes with Datadog
If you’d like to start visualizing your Hadoop metrics in our out-of-the-box dashboard, you can try Datadog for free. The Hadoop dashboard will be populated immediately after you set up the integration.
For a deep dive on Hadoop metrics and how to monitor them, check out our four-part How to Monitor Hadoop series.