Amazon ELB dashboard overview
When building out a dashboard to monitor ELB, it is important to create a comprehensive view of necessary performance metrics, error messages, such as requests per second, spillover count, HTTP response messages, as well as healthy and unhealthy hosts.
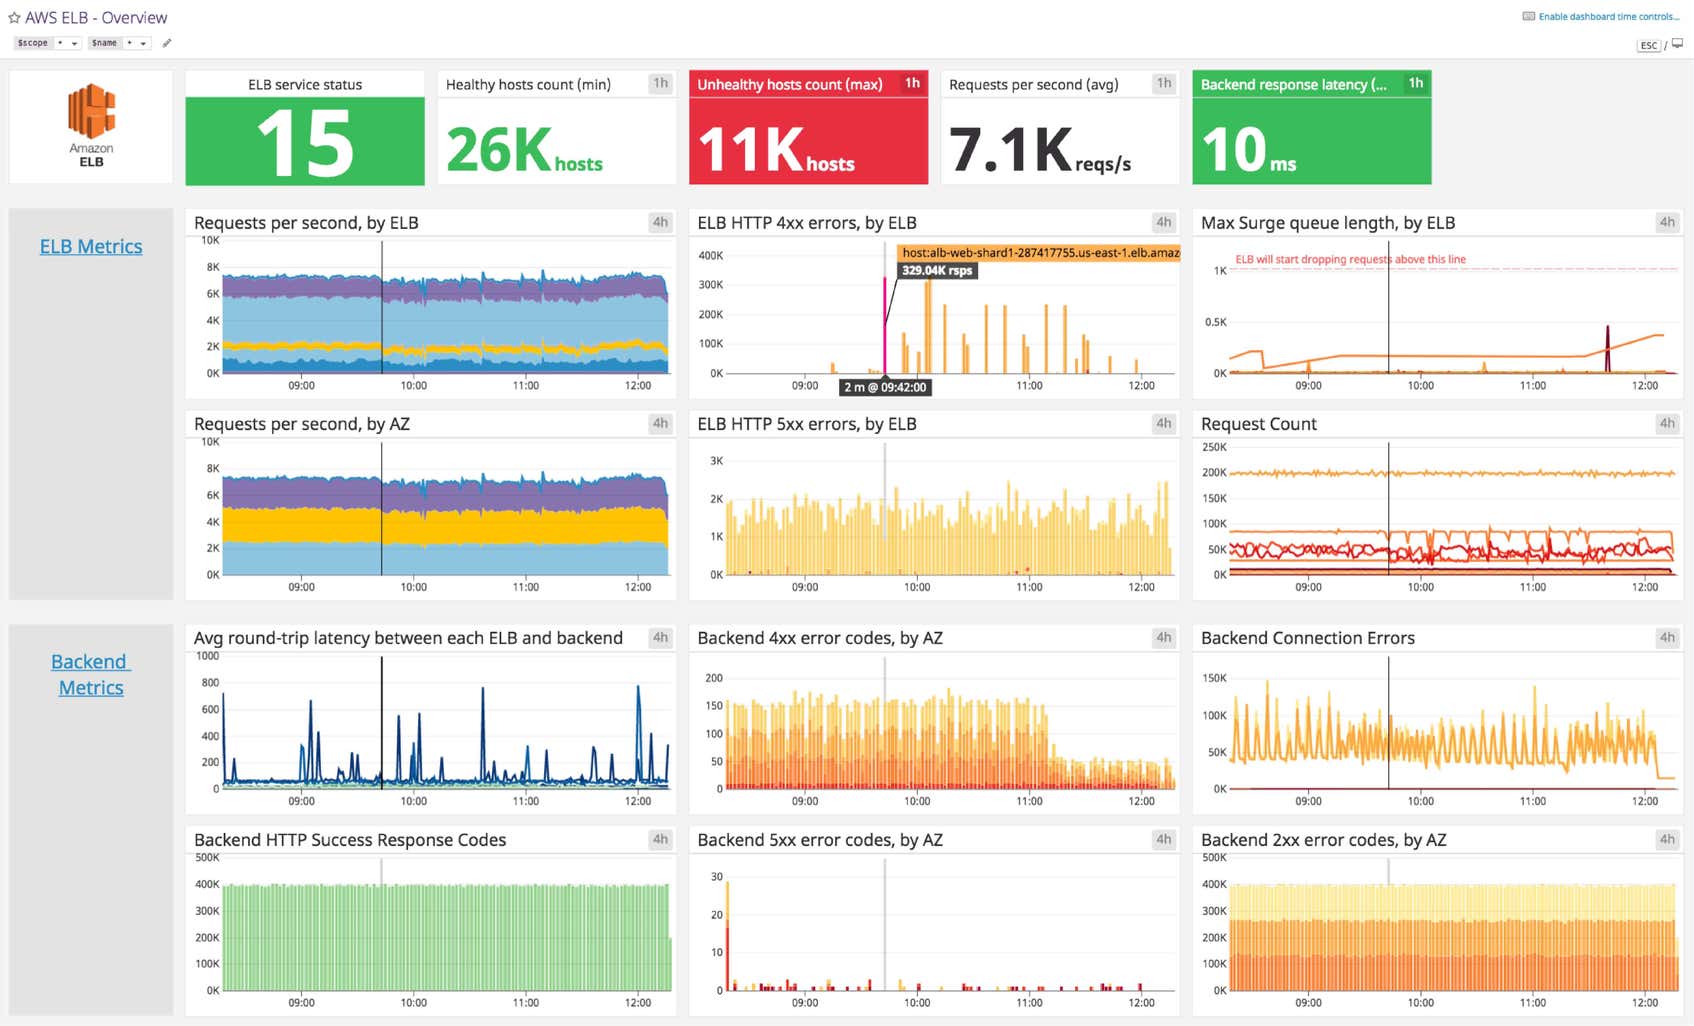
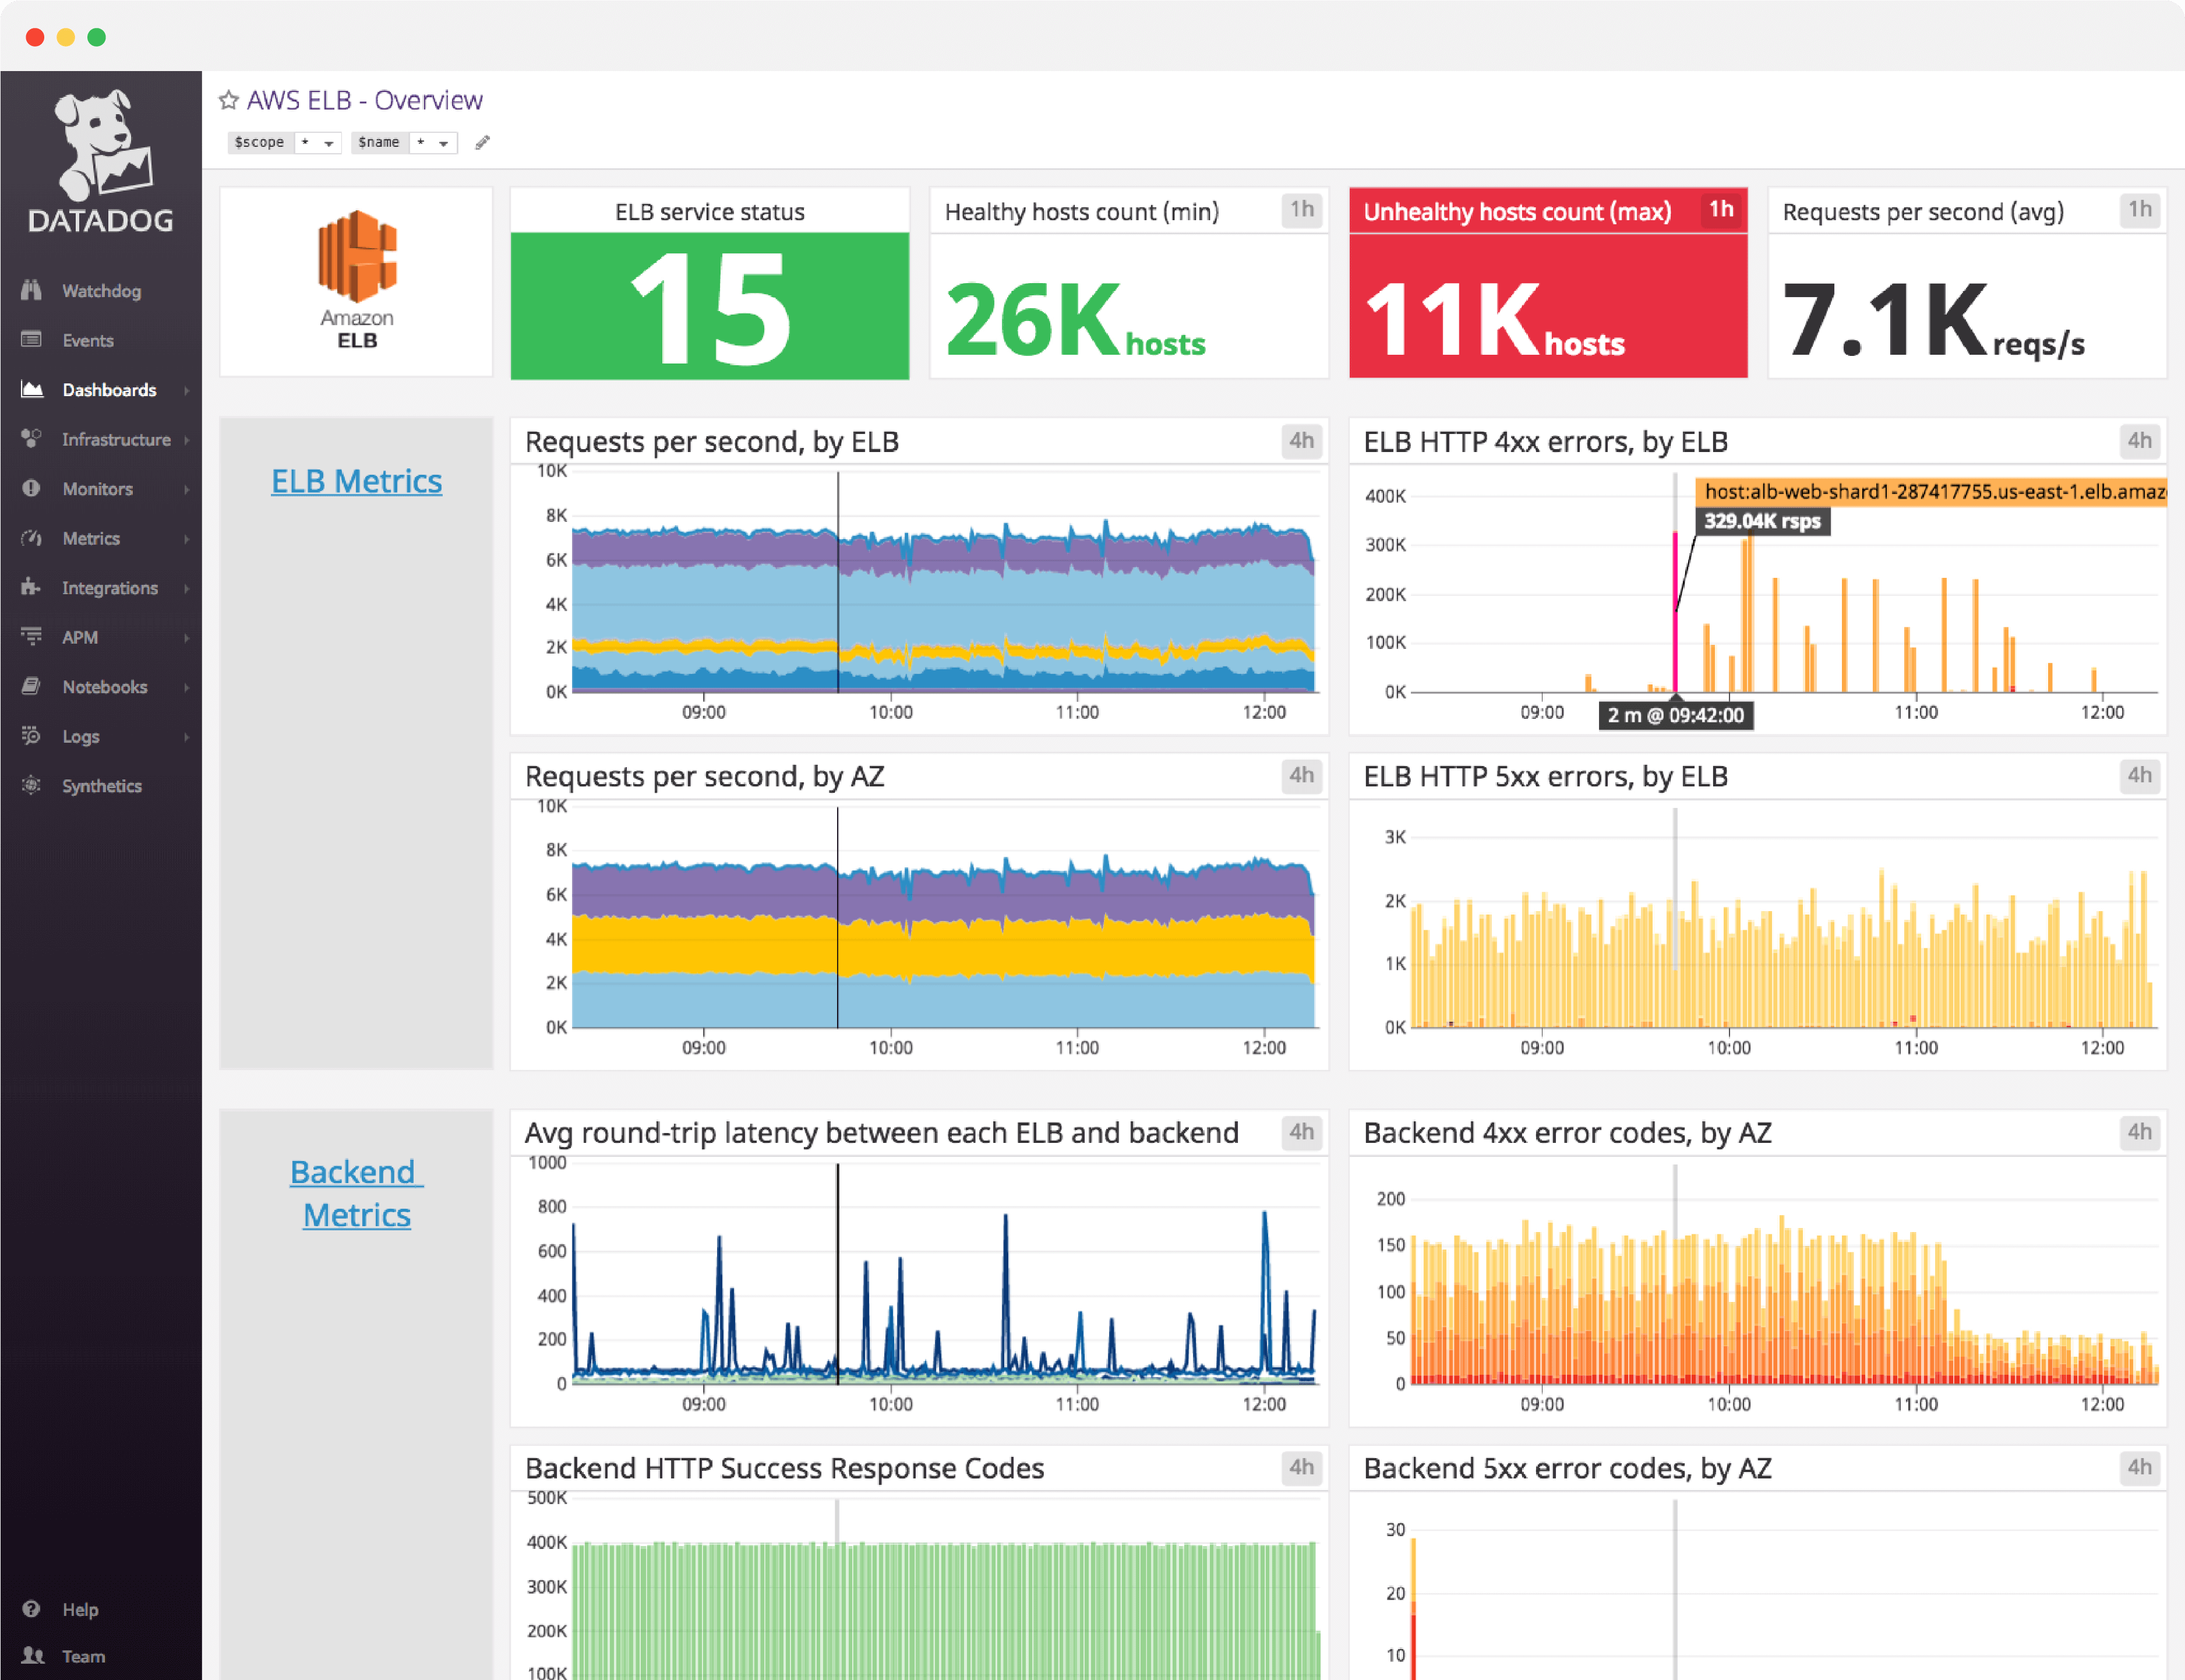
Datadog’s Amazon ELB dashboard visualizes key load balancer and backend-related metrics, as well as error and AWS event stream information in a single pane of glass. This page breaks down the metrics featured on that dashboard to provide a starting point for anyone looking to monitor ELB.
What is Amazon ELB?
Elastic Load Balancing (ELB) is an AWS service that dispatches incoming web traffic from your applications across Amazon EC2 backend instances, which may be in different availability zones (AZs). ELB, widely used for web and mobile applications, helps ensure a smooth user experience by increasing fault tolerance, handling traffic peaks, and managing failed EC2 instances without interruption.
Set up real-time Amazon ELB monitoring in minutes with Datadog's out-of-the-box dashboard.
Amazon ELB dashboard metrics breakdown
Load balancer metrics
Requests per second, by ELB
Tracks the total number of requests received by ELB and sent to registered EC2 backend instances each second. With the RequestCount metric, you can monitor the peaks and valleys of application traffic and set up alerts regarding drastic changes. These could indicate an issue with AWS or upstream problems, with your DNS for example. If you are not using Auto Scaling, tracking this metric will also help you determine when it’s necessary to adjust the number of instances backing your load balancer.
Requests per second, by Availability Zone
Availability zones help you design your application so that no single region of EC2 backend instances is overwhelmed by traffic. ELB distributes traffic among various AZs, which are connected via low-latency links, to ensure a smooth user experience. This metric tracks the distribution of requests per AZ to help you determine if one AZ is receiving a disproportionate traffic load compared to the others.
Max Surge queue length, by ELB
When your backend instances are fully loaded and can’t process any more requests, incoming requests are queued, which can increase latency and lead to slow user navigation or timeout errors. That is why this metric should remain as low as possible, ideally at zero. Backend instances may refuse new requests for many reasons, but it’s often due to too many open connections. In this case, you should consider tuning your backend or adding more backend capacity.
The max statistic is the most relevant view of this metric because it makes peaks of queued requests visible. Make sure the queue length always remains substantially smaller than the maximum queue capacity, currently capped to 1,024 requests, so you can avoid dropped requests.
Spillover count, by ELB
When the surge queue is full, new requests are dropped, the user receives a 503 error, and the spillover count is incremented. In a healthy system, spillover count is always zero.
Set up real-time Amazon ELB monitoring in minutes with Datadog's out-of-the-box dashboard.
Backend metrics
Average round-trip latency between each ELB and backend
Ths metric gives you good insight into your application performance by tracking latency due to request processing by your backend instances, and not from the load balancer itself. If it’s high, requests might be dropped due to timeouts, which can lead to frustrated users. If you’re experiencing high latency, it might be due to network issues, overloaded EC2 servers, or non-optimized configuration (enabling keep-alive can help reduce latency, for example). Here are a few tips provided by AWS to troubleshoot high latency.
Backend HTTP success response codes
The response codes this metric covers are HTTPCode_Backend_2xx and HTTPCode_Backend_3xx. 2xx codes indicate that the backend instances successfully addressed the request. The 3xx metric monitors redirections, but these requests are successfully addressed as well.
Healthy and unhealthy hosts counts
The HealthyHostCount and UnHealthyHostCount metrics give you an idea of backend instance availability in your application architecture. If an instance exceeds the unhealthy threshold defined for the health checks, ELB flags it as unhealthy and stops sending requests to that instance. The most common cause is the health check exceeding the load balancer’s timeout. Ensure you have enough healthy backend instances in each AZ to maintain good performance. Correlating these metrics with Latency and SurgeQueueLength allows you to see if you have enough instances to support the volume of incoming requests without substantially slowing down the response time.
Error metrics
ELB HTTP 4xx errors
This metric indicates the number of client errors returned by the load balancer in a given time period (sum). Because these are due to erroneous requests sent to ELB, there isn’t much you can do about them. However, you can track these issues in the access logs to monitor for any long-term issues.
ELB HTTP 5xx errors
This metric counts the number of requests that could not be properly handled. It can have different root causes:
- 502, Bad Gateway: The load balancer couldn’t parse the response due to internal error or malformed response.
- 503, Service Unavailable: Either the backend instance or ELB doesn’t have enough capacity to handle the given request.
- 504, Gateway Timeout: The response time exceeds the set ELB idle timeout, indicating a need to scale the backend, tune it, or increase idle timeout for slow operations.
Backend HTTP 4xx and 5xx errors
You want to monitor the HTTP codes returned by your backend for a high-level view of your servers. But for more granularity and better insight into your servers, you should monitor them directly by collecting native metrics from your instances and/or analyzing their logs.
AWS events stream
In the case of dropped requests and capacity issues, tracked AWS events can be alerted on to indicate the need for backend instance adjustments.
See your metrics in minutes with Datadog’s Amazon ELB dashboard
If you’d like to start visualizing your Amazon ELB data in our out-of-the-box dashboard, you can try Datadog for free. The ELB dashboard will be populated immediately after you set up the Amazon ELB integration.
For a deep dive on ELB metrics and how to monitor them, check out our three-part How to Monitor Amazon ELB series.