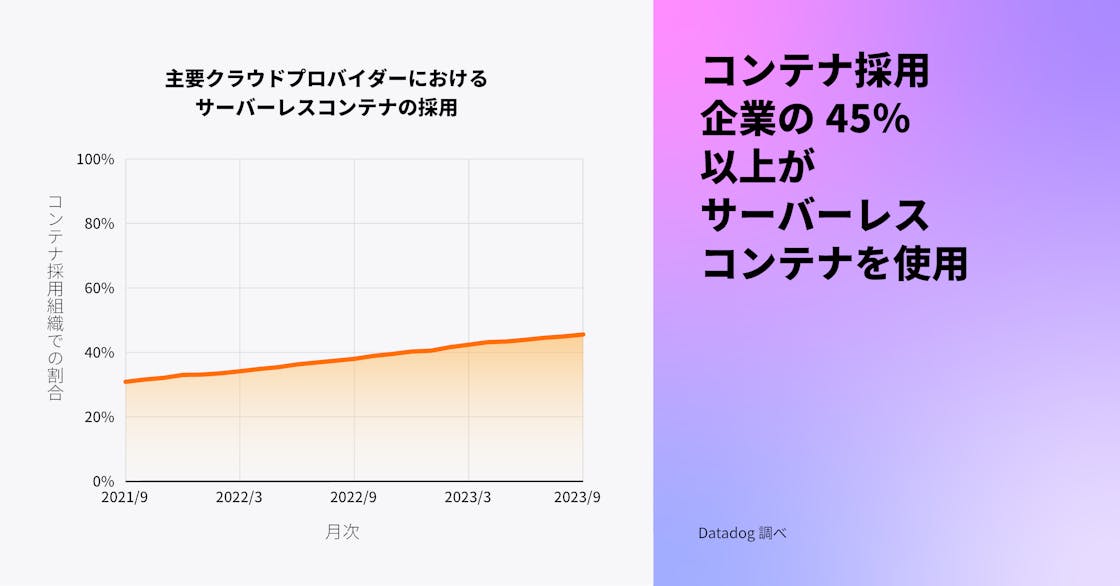
サーバーレスコンテナの採用は増加の一途
サーバーレスコンテナの採用は増加しており、コンテナを使用する組織の 46% がサーバーレスコンテナを運用しています。これは 2 年前の 31% からの増加です。コンテナの使用が成熟するにつれて、多くの組織が運用上のオーバーヘッドを減らし、開発の敏捷性を向上させ、コストを下げるためにサーバーレスコンテナを次のステップとして採用していると推測されます。クラウドプロバイダーがサーバーレスコンテナ用のインフラストラクチャーを完全に提供および管理することで、チームは新しいワークロードを迅速に立ち上げつつ、リソース利用の最適化という継続的な課題に対処することが可能になります。
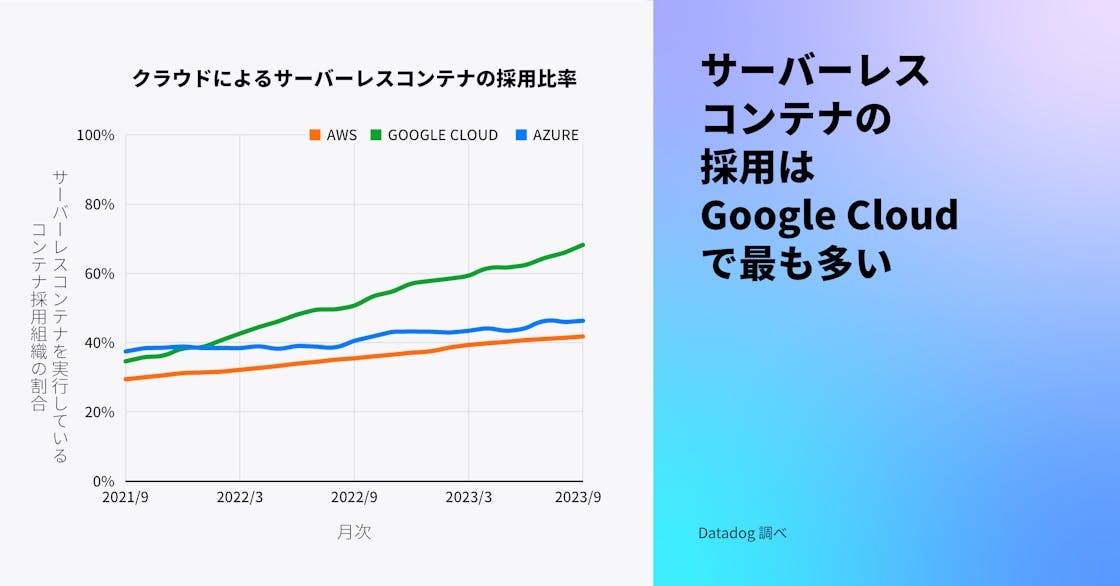
サーバーレスコンテナの採用はすべての主要なクラウドで増加しており、Google Cloud が先頭を走っています。Google Cloud では、コンテナを使用する組織の 68% がサーバーレスコンテナを利用しており、これは 2 年前の 35% からの増加です。この成長は、Cloud Run の上に構築された第 2 世代の Cloud Functions が 2022 年 8 月にリリースされたことが一因とされています。コンテナとしてパッケージ化された関数の成長については、今年のサーバーレスレポートでさらに詳しくお読みいただけます。
注: この調査の前提とした事実、
- 少なくとも以下のいずれかのサービスを使用している場合、組織はサーバーレスコンテナを使用しているとみなしています: Amazon ECS Fargate、Amazon EKS Fargate、AWS App Runner、Google Kubernetes Engine Autopilot、Google Cloud Run、Azure Container Instances、Azure Container Apps
“Google の GKE Autopilot や Cloud Run のようなサーバーレスコンテナサービスを利用することで、チームはコストとリソースを節約しながら、ビジネスの中核をなすニーズに合わせたアプリケーションの構築に集中できます。GKE は現在、業界で最もスケーラブルな Kubernetes サービスであり、クラウドとコンテナを使用して AI を駆使したビジネスに不可欠なアプリケーションを実行し、ビジネスの変革を支援します。GKE は、Google が 20 年近くにわたって大規模にコンテナを運用する際に得た主要なインサイトを公開し、検索、マップ、YouTube などの製品を強化しています。Google は 2014 年に Kubernetes をオープンソース化し、プロジェクトに対して 100 万以上の貢献を行うことでコミュニティをリードしています。Google Cloud の管理されたコンテナプラットフォームを利用することで、リソース利用の効率が向上し、クラウド支出がより賢明になり、お客様の運用上の負担が減少します。”
Google Cloud、クラウドランタイム担当 GM 兼 VP
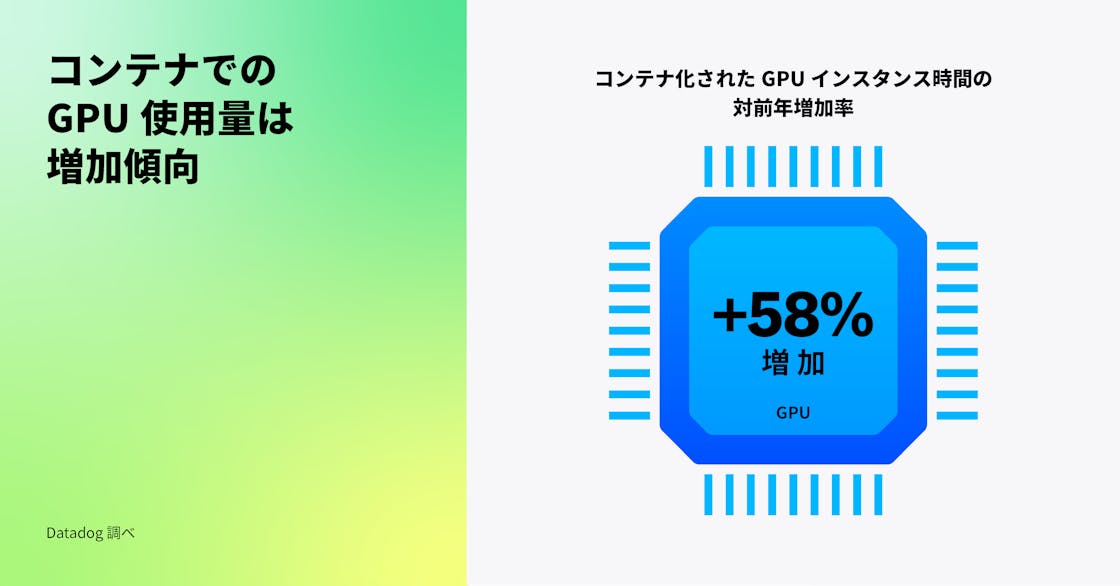
コンテナ化されたワークロードでの GPU ベースのコンピュートの利用が増加
GPU は伝統的に、コンピュータグラフィックスやアニメーションなどの計算集約型アプリケーションに利用されてきましたが、現在では ML や大規模言語モデル (LLM) の効率的なトレーニング、推論の実行、大規模データセットの処理にも使用されています。これらのワークロードの増加を調査したところ、コンテナ化された GPU ベースのインスタンスによる計算時間が前年比 58% 増加していることがわかりました (一方で、コンテナ化されていない GPU ベースの計算時間は同期間で 25% 増加しています)。
AI/ML ワークロードに必要なデータ処理の規模が拡大する中で、コンテナ上の GPU ベースのコンピュートの成長が非コンテナ化されたものを上回っているのだと考えられます。LLM やその他の ML モデルは数百テラバイトに及ぶ非構造化データ上でトレーニングする必要があり、このプロセスは従来の Web サービスワークロードの典型的なデータ処理要件と比較して計算負荷が指数関数的に高くなります。より多くの GPU ベースのコンピュートオプションが利用可能になるにつれ、お客様はコンテナを活用してワークロードを異なるクラウドプロバイダー間で移行し、より良いコストメリットを享受することもできるようになります。
AI/ML ワークフローを迅速に開始するためには、AWS Deep Learning Containers などのパッケージ化されたコンテナイメージを使用するか、またはコンテナ化されたワークロードに GPU を割り当てることができるマネージド Kubernetes サービスを採用することができます。次世代 AI ベースのアプリケーションに対する投資が拡大し、それらのモデルに必要な非構造化データの量が増加するにつれて、組織は開発の敏捷性を高め、データからより深いインサイトを得るために、コンテナ上で GPU ベースのワークロードを実行することが増えていくと私たちは考えています。
“GPU の人気が高まったのは、ゲームやグラフィックレンダリング、その他の複雑なデータ処理タスクへの応用がきっかけでした。開発中の AI/ML ベースのアプリケーションが増加する中で、コンテナ化されたワークロード内での GPU ベースのコンピュート使用量が著しく増加していると Datadog が報告していることに驚きはありません。OctoML では、過去 12 か月にわたり AI の採用に伴い GPU コンピュートの使用が大幅に増加しているのを目の当たりにしています。当社のお客様は、当社のプラットフォームである OctoAI を通じて、毎日何百万もの AI 推論コールを実施しており、成長率は急速に加速しています。”
Chief Product Officer, OctoML
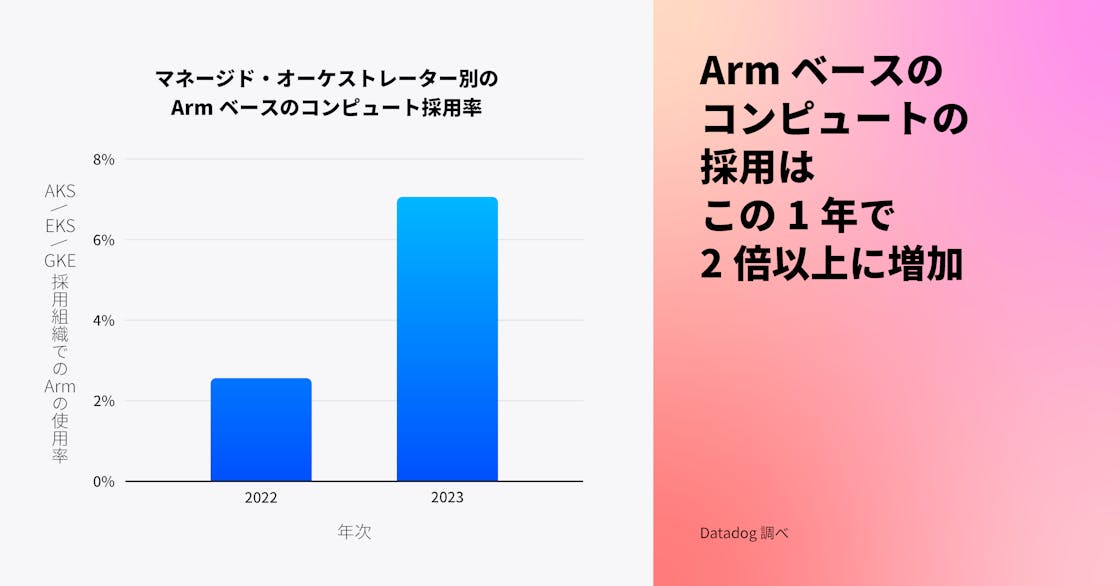
コンテナ化されたワークロード向けの Arm ベースのコンピュートインスタンスの採用が過去 1 年間で 2 倍以上に増加
コンテナに最適化された Arm ベースのインスタンスは、より低いエネルギー消費と発熱量により、x86 ベースのインスタンスと比較してコストを 20% 削減できます。Datadog では、多くのエンジニアリングチームが、アプリケーションのパフォーマンスを犠牲にすることなくクラウド支出を削減することに成功しています。他の組織でもコンテナ化されたワークロードで同様の成功を収めており、マネージド Kubernetes サービスを利用する組織での Arm ベースのコンピュートインスタンスの採用率は、過去 1 年間で 2.6% から 7.1% へと 2 倍以上に増加しました。今後も多くの組織がコスト削減の利点を活用するために Arm への移行を進めると予想されますが、使用するプログラミング言語、ライブラリ、フレームワークの互換性を確保するためのアプリケーションのリファクタリングが必要となるため、採用が妨げられる可能性もあります。
“Datadog では、多くの Intel CPU 互換ワークロードを Arm ベースのコンピュートに移行し、同等のパフォーマンスとより多くの機能をより良い価格で提供しています。これを実現するため、ワークロードをサイズとパフォーマンス要件に基づいて分類し、効果的な中央ビルドインフラを優先して提供し、Arm 採用を推進する機会としてメジャーバージョンのアップグレードや計画的な移行を利用しています。”
Datadog、インフラストラクチャー・信頼性エンジニアリング担当VP
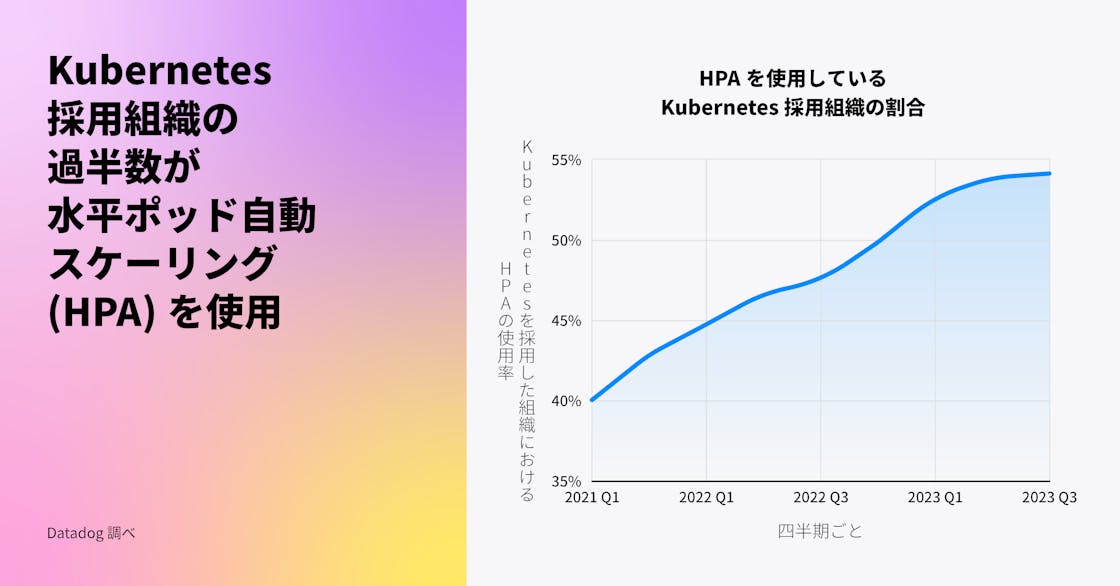
半数以上の Kubernetes 組織が水平ポッド自動 スケーリング (HPA) を採用
クラウドコンピューティングの主な利点の 1 つは弾力性です。Kubernetes でこれをサポートする方法の 1 つとしては、水平ポッド自動 スケーリング (HPA) が挙げられます。HPA は、現在の負荷に応じてポッドを自動的にデプロイまたはスケールバックします。これにより、組織はトラフィックの急増時にスムーズなユーザーエクスペリエンスとアプリのパフォーマンスを維持し、アクティビティが少ない期間には実行中のポッドの数を自動的に調整することでインフラストラクチャーのコストを削減できます。
私たちは以前、Kubernetes 組織の間で HPA の人気が高まっていることを指摘しました。この傾向は今日まで続いており、現在、Kubernetes 組織の半数以上がワークロードのスケーリングに HPA を使用しています。
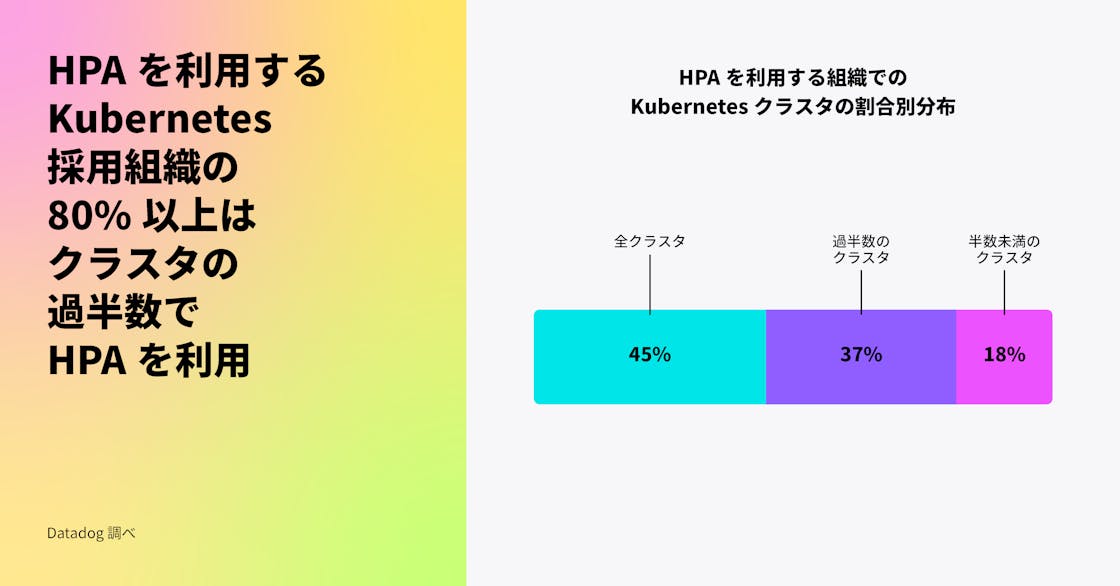
HPA を採用した組織は、環境の小さなサブセットで HPA を使用するだけでなく、これらの組織の 80% 以上がクラスターの少なくとも半分でこの機能を有効にしており、45% はあらゆる場所で有効にしています。
HPA の人気は、Kubernetes が時間をかけてこの機能に大幅な機能強化をリリースしてきたことによるものだと考えています。HPA が導入された当初は、CPU のような基本的なメトリクスからポッドをオートスケールすることしかできませんでしたが、v1.10 のリリースにより、外部メトリクスのサポートが追加されました。Kubernetes コミュニティが HPA の機能を強化し続けているため、多くの組織が新しいリリースを早期に採用し、オートスケール戦略を微調整しています。例えば、HPA は現在、ContainerResource タイプのメトリクス (v1.27 でベータ機能として導入) をサポートしており、ユーザーはポッド全体ではなく、キーコンテナのリソース使用量に基づいてワークロードをよりきめ細かくスケーリングできます。
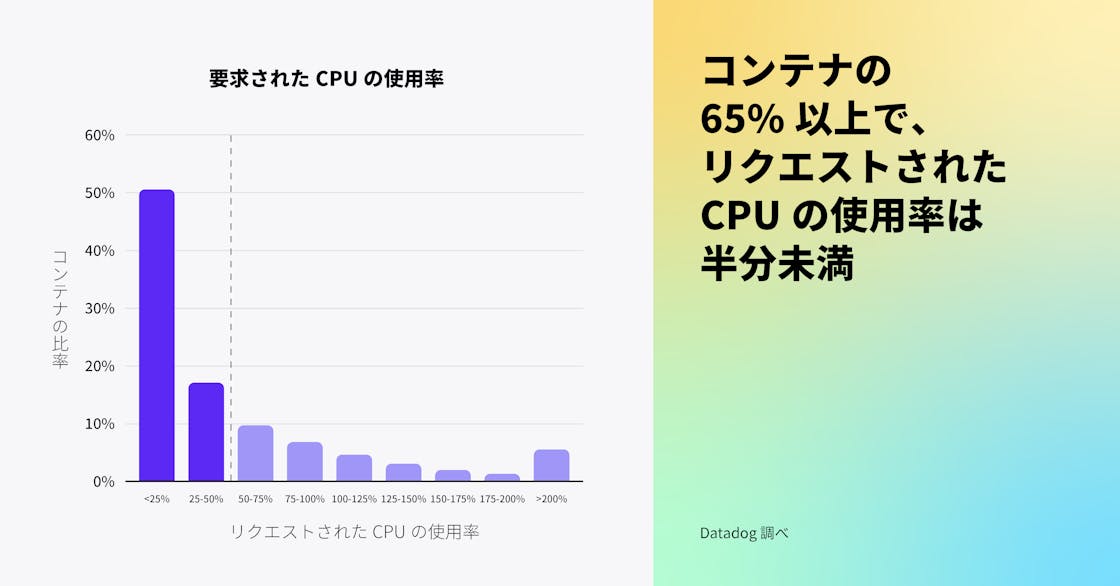
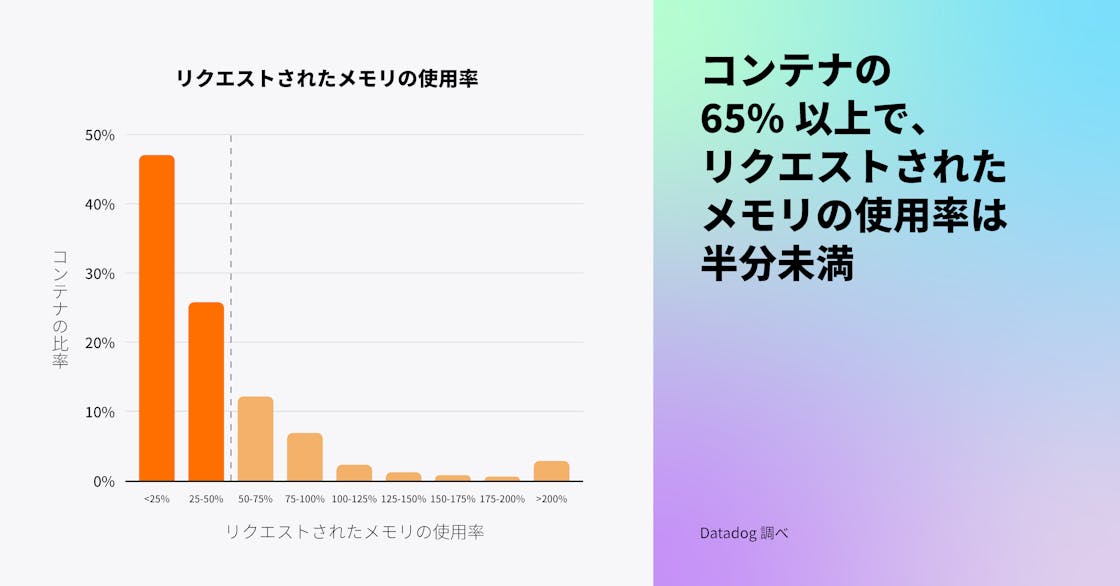
Kubernetes 環境の多くで割り当てたリソースの一部しか利用していない
Kubernetes ユーザーは、コンテナが最小限のリソースにアクセスできるようリクエストを設定できますが、私たちのデータによると、これらのリクエストはしばしば必要以上に高く設定されており、65% 以上の Kubernetes 環境がリクエストされた CPU およびメモリの半分未満しか使用していません。これは、ワークロードの適正サイズ設定がいかに難しいかを示しています。お客様から、追加コストがかかるものの、エンドユーザーへのインフラストラクチャー容量問題の影響を避ける方法として、コンテナのリソースを過剰にプロビジョニングすることを選ぶことがよくあると聞いています。Datadogのデータに基づくと、リソース利用を最適化しインフラストラクチャーコストを削減するための余地はまだたくさんあると考えられます。
私たちは、互換性のある、または利用可能なコスト最適化ツールがないために、組織がこのような課題に直面していると考えています。Vertical Pod Autoscaler (VPA) は、コンテナの CPU とメモリのリクエストと制限を、過去のリソース使用量に基づいて推奨する Kubernetes の機能です。しかし、VPA を使用している Kubernetes 組織は全体の 1% 未満であり、この数字は 2021 年の VPA の採用を調査して以来横ばいであることがわかりました。VPA の採用率が低いのは、この機能がまだベータ版であり、特定の制限があるためではないかと考えています。例えば、CPU およびメモリのメトリクスでは、HPA と並行して使用することは推奨されておらず、現在、半数以上の組織が HPA を使用しています。組織がクラウド請求額をさらに削減しようとし、より多くのコスト最適化ソリューションが利用可能になるにつれて、リソースを非効率的に使用しているワークロードを特定し、その使用を最適化することを容易にする Kubernetes Resource Utilization ツールの採用が増加すると予想されます。
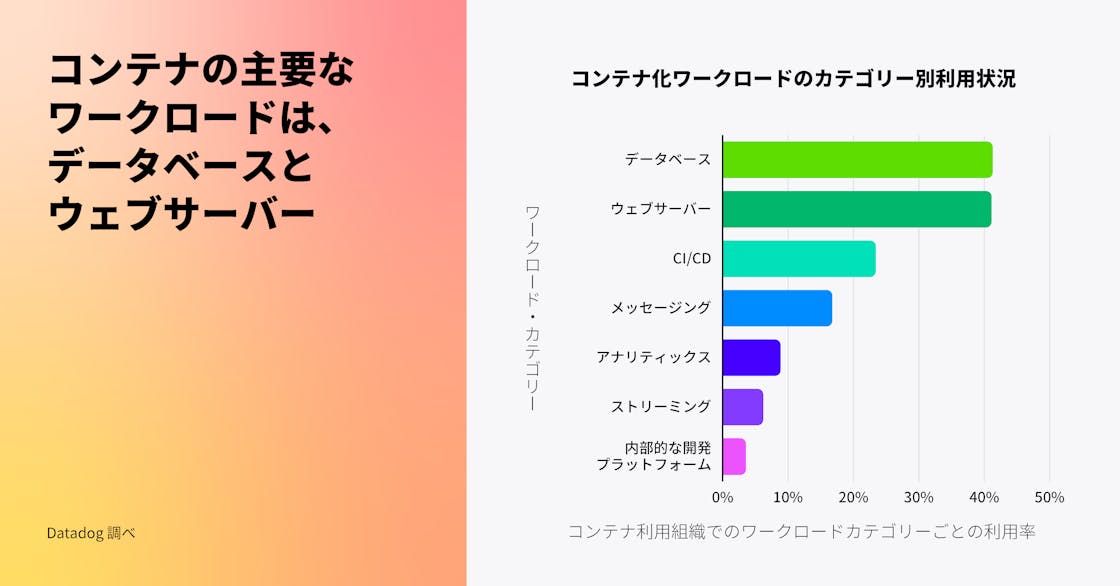
データベースと Web サーバーがコンテナの主要な利用用途
前回の調査では、最も人気のあるコンテナイメージを分析しましたが、今年はこれらのテクノロジーを分類し、コンテナ利用の集計傾向を示しました。当社のデータによると、データベースと Web サーバーは、現在、企業で最も人気のあるワークロードです。コンテナは長い間、ステートレスな Web アプリケーションやバッチアプリケーションを実行するための一般的な方法でしたが、お客様はステートフルなアプリケーションを自信を持って実行できるよう、コンテナの利用を進化させてきました。コンテナ企業の 41% 以上が、コンテナ上でデータベースをホスティングしています。Datadog の以前のデータでは、Redis と Postgres が最も人気のあるコンテナイメージのリストの上位に常にランクされていることを明らかになりましたが、今回の発見も同じくこのデータを補強するものです。
長年にわたり、コンテナエコシステムは、コンテナ上にステートフルなアプリケーションをデプロイしようとする企業のニーズを満たすために成熟してきました。Kubernetes v1.9 で StatefulSets がリリースされたことで、企業はポッドの再起動時にデータを永続化できるようになり、ボリュームスナップショットスナップショットやダイナミックボリュームプロビジョニングなどの追加機能により、データをバックアップしてストレージを事前にプロビジョニングする必要性をなくすことができるようになりました。AWS のようなクラウドプロバイダーは、EKS on Fargate のようなサーバーレスサービスを含め、コンテナ上でステートフルなワークロードを実行するためのビルトインサポートを現在提供しており、K8ssandra のようなオープンソースツールも Kubernetes 環境でのデータベースのデプロイを容易にしています。
注: この調査について、視覚化で用いた分類は以下のように定義しています。
- データベース: Redis、MySQL、その他
- Web サーバー: NGINX、OpenResty、その他
- CI/CD: Jenkins、Argo CD、その他
- メッセージング: Kafka、RabbitMQ、その他
- アナリティクス: Hadoop、Elasticsearch、その他
- ストリーミング: Spark、Flink、その他
- 内部的な開発プラットフォーム: Crossplane、Garden、その他
“ステートレスワークロードをサポートする初期の段階から、Kubernetes はデータ中心のワークロードを支援するまでに進化しました。リアルタイムデータからのビジネス上の利益と、Kubernetes によるスケーラビリティと耐障害性のメリットを活かすため、多くの企業がステートフルワークロードのためのコンテナ化インフラストラクチャーを導入しています。データベースは Kubernetes 上で実行されるワークロードの中で最も一般的であり、Kubernetes コミュニティが構築している機能と Data On Kubernetes Community (DoKC) の取り組みにより、今後さらに多くのエンドユーザーがデータワークロードのホストに Kubernetes を選択するでしょう。”
Data on Kubernetes Community マネージング・ディレクター
Node.js は引き続きコンテナ向けの主要言語
Node.js はコンテナ用のプログラミング言語として引き続き最も人気があり、Java と Python がそれに続いています。この傾向は、2019 年にこのデータを最後に分析したときと一致しています。Node.js で構築されたアプリケーションは軽量でスケーラブルなため、コンテナとしてのパッケージングやデプロイに自然に適しています。4 番目に人気のある言語は PHP から Go に変わりました。これは、Go のシンプルさ、スケーラビリティ、クラウドネイティブアプリケーションの開発速度が高いことを示しています。クラウドプロバイダーにより優れたビルドツール、ライブラリ、デバッグサポートが提供されるようになったため、コンテナ上で C++ を使用する組織の割合も増加しています (組織が複数の言語を使用する可能性があるため、合計すると 100% を超えることに注意してください)。
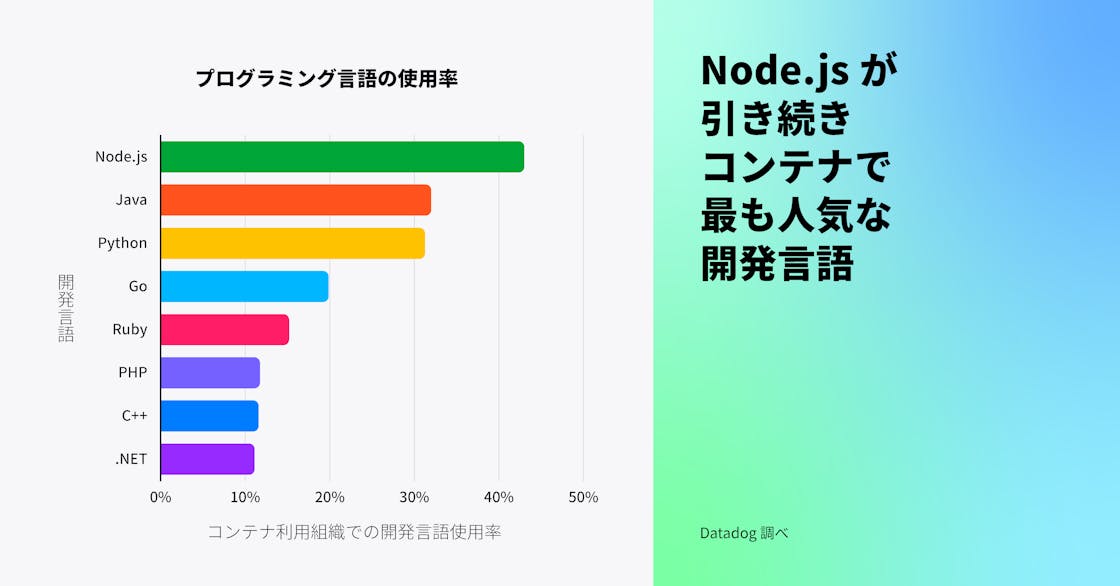
Java はエンタープライズアプリケーションの市場で大きなシェアを占め、コンテナ化されていない環境においても引き続き最も人気のある言語であるとされています。お客様との対話に基づくと、多くのお客様が Java ベースのレガシーアプリケーションをコンテナで動作させるよう移行を開始しています (あるいはそのプロセスにあります)。エンタープライズアプリケーションのモダナイゼーションや、OpenJDK のコンテナ認識機能など、コンテナ特化機能の開発を背景に、コンテナ環境での Java の使用は今後も成長が見込まれます。
大規模なコンテナ環境を持つ組織では、サービスメッシュが利用されている
Datadog は、Envoy や NGINX などのサービスメッシュ技術が使用され始めたことを 2020 年に指摘しました。今年、我々は Istio、Linkerd、Traefik Mesh などより幅広いテクノロジーを調査に含め、サービスメッシュの採用状況についてさらに包括的な視野を持つことができました。サービスメッシュの利用は組織のホスト規模に比例して増加する傾向があり、1,000 台以上のホストを運用する組織の 40% 以上がサービスメッシュを使用していることが観察されました。
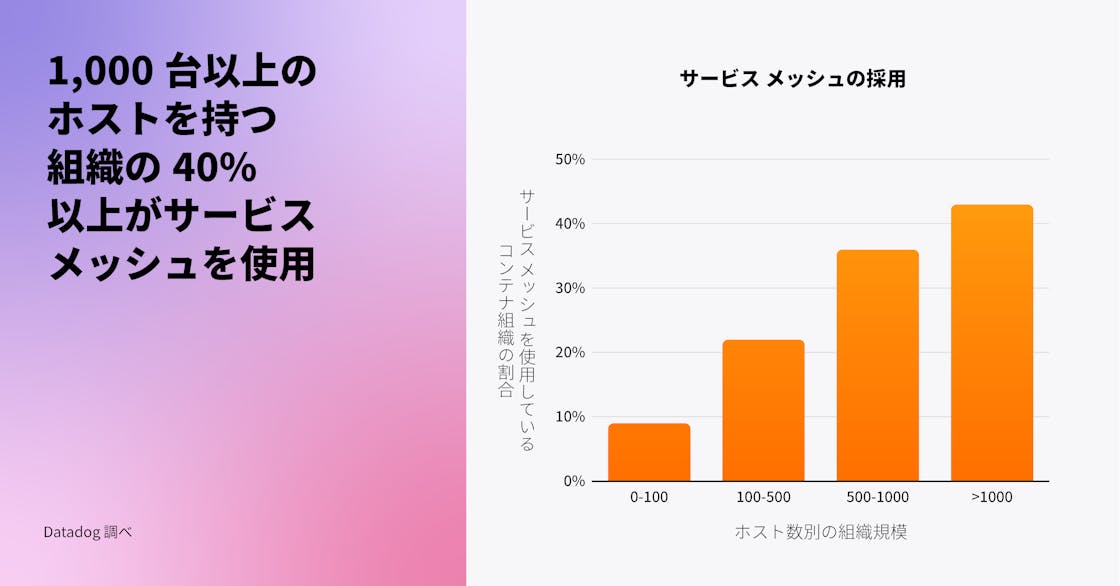
サービスメッシュが大規模な環境でより普及している理由の一つは、大規模におけるサービスの通信経路、セキュリティ、監視の課題を解決する手助けになるためでしょう。サービスメッシュは、相互 TLS、負荷分散、クロスクラスター通信といった機能の実装の複雑さを軽減する内蔵ソリューションを提供します。既存サービスをコンテナへ移行し、ノードのフットプリントを広げている組織が増えるにつれ、特に大規模デプロイメントでサービスメッシュがさらに普及すると考えられます。
コンテナランタイムの主流は Docker に代わって containerd に
2021 年、Datadog は Kubernetes における dockershim の非推奨化に伴い、containerd ランタイムの採用が増加していることを報告しました。過去 1 年間に containerd の採用は 2 倍以上に増え、コンテナを使用する組織の 53% が containerd を使用していますが、1 年前は 23%、2 年前は 8% でした。一方で、CRI-O の採用はそれほど伸びていません。dockershim をサポートしない新しいバージョンの Kubernetes に多くの組織が移行したため、Docker の使用率は過去 1 年間で 88% から 65% へと低下しました (組織が複数のコンテナランタイムを使用する場合があるため、パーセンテージは 100% を超えることに注意してください)。
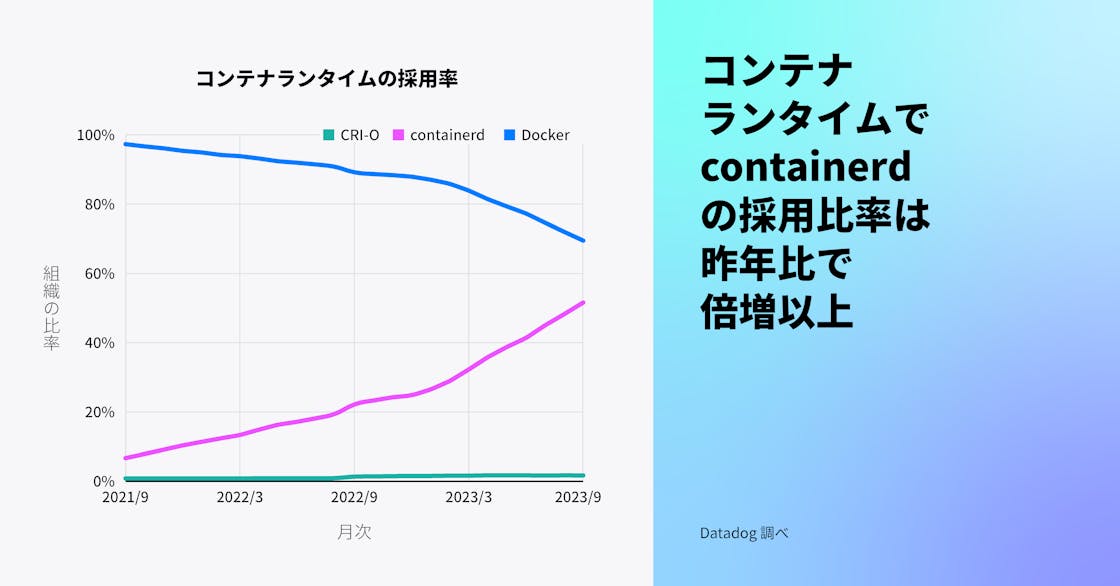
Kubernetes v1.24 以降 Docker のサポートが非推奨となりましたが、新しいランタイムに移行する準備ができていないチームは、cri-dockerd アダプタを介して Docker を使用することが可能です。しかし、より多くのチームが Kubernetes の新しいバージョンにアップグレードし、将来のサポートを視野に入れた環境のロードマップを立てるようになるにつれて、containerd が Docker を追い越して主流のランタイムになると予想されます。
“Kubernetes プロジェクトは、Kubernetes リリース v1.24 で dockershim を削除することで Docker のビルトインサポートを進化させたため、containerd を使ったコンテナデプロイが増えるのは時間の問題でした。containerd ランタイムは本質的に軽量で、オープンソースコミュニティによって強くサポートされています。containerd は Docker エンジンから進化し、現在では CNCF のトッププロジェクトの 1 つで、ほとんどのハイパースケーラーがマネージド Kubernetes の提供に使用しています。”
クラウド・ネイティブ・コンピューティング・ファウンデーション CTO
ユーザーは以前よりも早く新しい Kubernetes リリースにバージョンアップしている
Kubernetes は毎年、バグの修正、セキュリティの問題への対処、ユーザーエクスペリエンスの改善のために 3 つの新しいバージョンをリリースしています。昨年、多くのユーザーが新バージョンの採用に慎重であり、各バージョンの安定性をテストし、自身のワークロードとの互換性を確認するために時間を要していることが観察されました。
現在、Kubernetes v1.24 (執筆時点で 16 か月前のリリース) が最も普及しており、これは歴史的な傾向と一致しています。しかし、今年になって Kubernetes の新しいバージョンの導入が顕著に増加しました。Kubernetes を使用する組織の 40% が、約 1 年以内にリリースされたバージョン (v1.25 以上) を採用しており、これは 1 年前の 5% と比較して大きな進歩です。
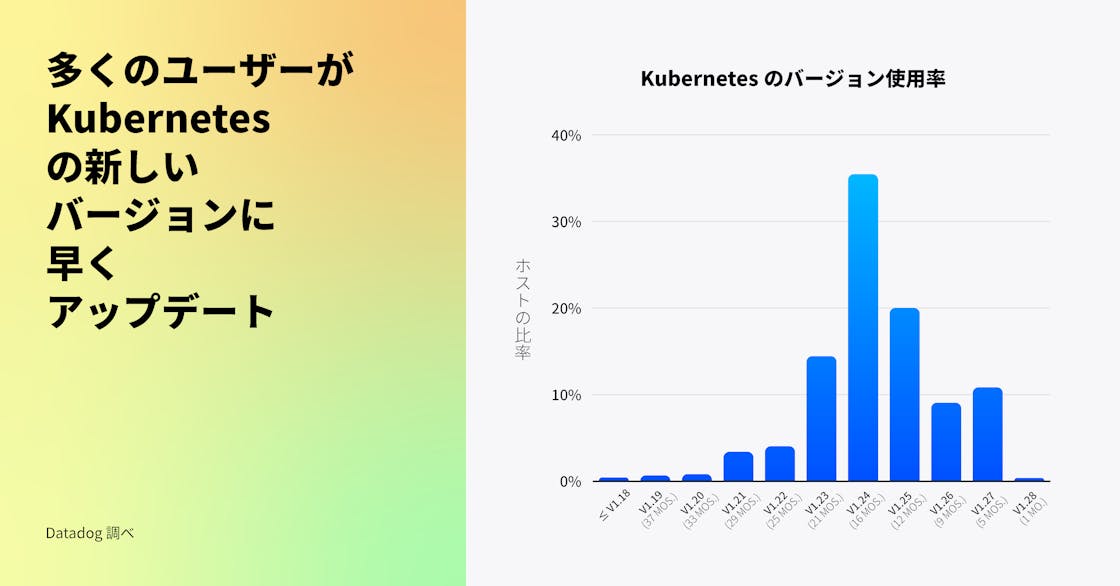
お客様からのフィードバックによれば、Service Internal Traffic Policy (v1.26 でリリースされた) や、コンテナごとのリソース使用量に基づいた Horizontal Pod Autoscaling の構成機能 (v1.27 でベータ版としてリリースされた) などの新機能を活用するため、より早期に新リリースへのアップグレードを行う企業が増えています。これらの機能はクラスターのより詳細な制御を可能にし、運用コストを削減する助けとなります。また、マネージド Kubernetes サービスは、例えば GKE Autopilot が標準でクラスターをリリース後数か月で最新の Kubernetes バージョンに自動アップグレードするなど、ユーザーがクラスターをより迅速にアップグレードするのを支援しています。新しい Kubernetes の機能を最大限に活用するために Autopilot などのマネージドサービスを採用し、ワークロードのアップグレードを進める企業が増えるにつれ、リリースの採用が左にシフトしていくことが予想されます。安全にこれを行う一つの方法は、本番環境での新リリースを広く展開する前に、ミッションクリティカルでないワークロードを先にアップグレードすることです。