October 2021更新 This research builds on previous editions of our container usage report, container orchestration report, and Docker research report.
Container orchestration is now the norm. Today, almost all containers are orchestrated, with Kubernetes used by over half of organizations. In this report, we examined more than 1.5 billion containers run by tens of thousands of Datadog customers to understand how they are scaling and supporting their container environments.
Beyond overall adoption, orchestrated environments are also becoming more complex. To support their increasingly dynamic applications, the vast majority of organizations rely on cloud provider-managed services, including serverless platforms like AWS Fargate. We also see organizations auto-scaling their container infrastructure and building stateful applications, which suggests that they are starting to reap the benefits of orchestration tools and their advanced features.
Read on for more insights and trends gathered from the latest real-world usage data.

Nearly 90 percent of Kubernetes users leverage cloud-managed services
Managed Kubernetes services, such as Amazon Elastic Kubernetes Service (EKS), Google Kubernetes Engine (GKE), and Azure Kubernetes Service (AKS), have seen significant growth in recent years and are still the standard for managing container environments in the cloud. As of today, almost 90 percent of Kubernetes organizations use a managed service as opposed to running self-managed clusters, a 19-point gain from last year. We expect this trend to continue as more organizations adopt Kubernetes and leverage the cloud to build highly available and performant applications.


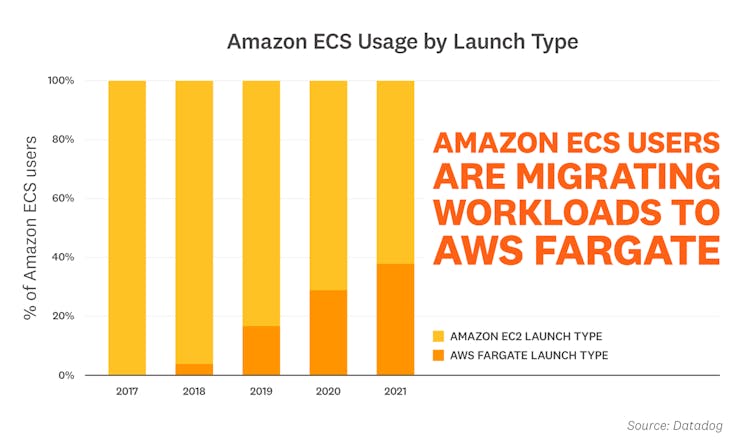
Amazon ECS users are shifting to AWS Fargate
Since its launch in 2017, AWS Fargate has experienced increased adoption by organizations using Amazon Elastic Container Service (ECS). Over the past few years, we've seen a noticeable shift from running ECS workloads on Amazon Elastic Compute Cloud (EC2) to using the AWS Fargate launch type. This trend suggests that organizations are increasingly seeing value in migrating to serverless environments, which is consistent with the growth we've seen this year in serverless adoption in general.

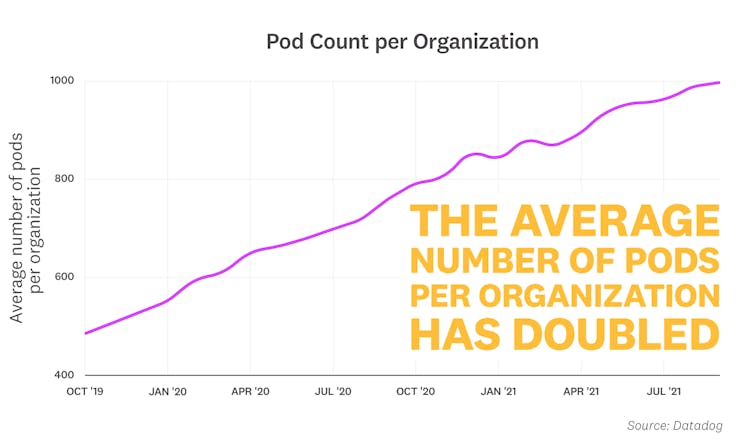
The average number of pods per organization has doubled
Organizations using Kubernetes are continuing to scale their container environments, both by devoting more hosts to running containers, and by leveraging more pods to support their workloads. Within the past two years, the average number of pods per organization has doubled, with a similar relative increase in the average number of Kubernetes hosts. This substantial growth points to how organizations are investing heavily in Kubernetes—and shifting more of their infrastructure and workloads to containers.

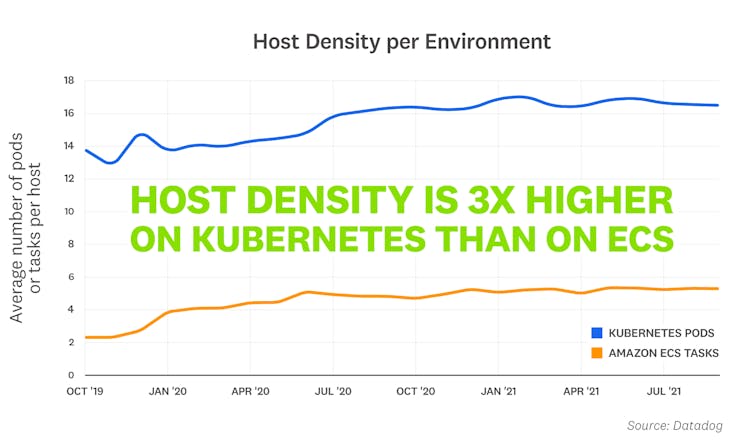
Host density is 3 times higher on Kubernetes than on Amazon ECS
On average, Kubernetes organizations run 16 pods per host, while organizations using Amazon Elastic Container Service (ECS) run 5 tasks per host. These numbers have remained consistent for both environments over the past year, suggesting that organizations are finding the right number of pods and tasks to support their applications. We also found that both Kubernetes pods and ECS tasks are running an average of 1.5 containers.
The difference in host density suggests that Kubernetes organizations are becoming even more efficient at "bin packing," or running more pods per host to take full advantage of available resources. The higher density is also likely related to the growth we've seen in the number of Kubernetes users auto-scaling their pods in response to an application's resource consumption.

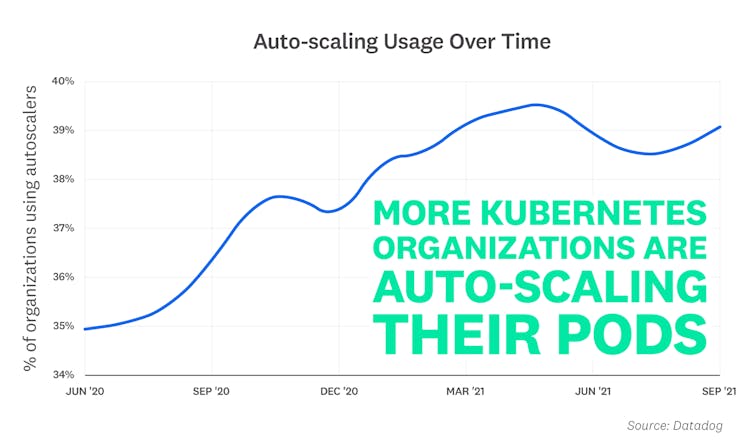
Pod auto-scaling is becoming more popular
Kubernetes can automatically scale pods horizontally or vertically based on metrics reported from Kubernetes or other sources in order to build highly available and performant container applications. Most managed Kubernetes services, including Azure Kubernetes Service (AKS), Oracle Kubernetes Engine (OKE), and Amazon Elastic Kubernetes Service (EKS), offer both Horizontal Pod Autoscaler (HPA) and Vertical Pod Autoscaler (VPA) functionality. Horizontally scaling out the total number of pods ensures that applications can support fluctuations in demand, while vertically scaling individual pods' CPU and memory helps manage an application's overall performance and costs. Our research shows a clear trend: more Kubernetes organizations are auto-scaling their pods. Scaling pods horizontally accounts for most of that growth, with approximately 40 percent of Kubernetes organizations using HPAs, as opposed to less than 1 percent of organizations that use VPAs.
HPA's ease of use may contribute to the wide gap between the two methods, as scaling vertically is more difficult than changing the total number of running pods for a workload. VPAs are also fairly new compared to HPAs, which have become the default scaling method for widely used Kubernetes services, such as Istio and NGINX Ingress Controller. Organizations are more likely to have HPAs in their environments as a result, but we are interested to see how VPA usage grows over time.
“Most applications our customers deploy with the Oracle Kubernetes Engine (OKE) service face dynamic loads and require high availability at predictable, low latencies. Our developers are looking to leverage the benefits of auto-scaling and rightsizing their applications, in addition to having a consistent and portable development environment. OKE's ability to auto-scale pods horizontally and vertically delivers all of those benefits, so customers can focus on developing their mission-critical applications without any disruption.”
—Dan Gerrity, SVP Developer Services, Oracle

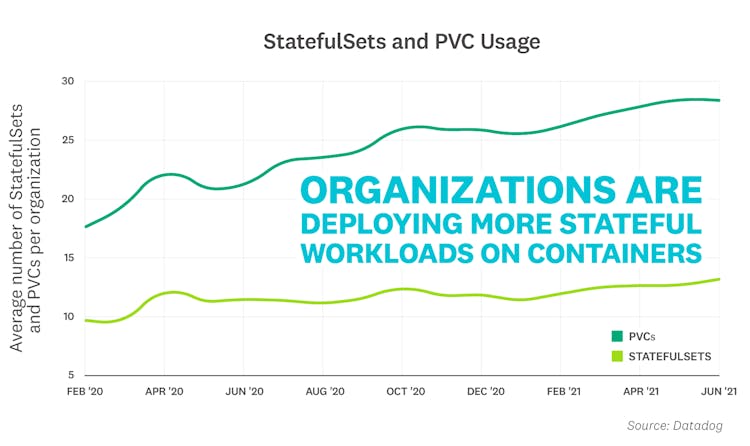
Organizations are deploying more stateful workloads on containers
Container infrastructure is short-lived and dynamic by nature, but we are seeing more organizations leverage Kubernetes to support applications that require durable storage and persistent identity, such as data-driven applications. To do this, organizations are using Kubernetes StatefulSets and Persistent Volumes (PVs). StatefulSets are responsible for scheduling and scaling pods with unique, stable identifiers and can request PVs via Persistent Volume Claims (PVCs) to provide durable storage for stateful applications.
Today, organizations use an average of 13 StatefulSets and 28 PVCs, which points to an increased reliance on Kubernetes to support a large variety of workloads, including stateful applications.
“Since StatefulSets became generally available in 2017, we've used them to evolve our infrastructure towards a container-centric model. We've built our business around storing huge amounts of data in open source and proprietary data stores in the most efficient way possible. Running those workloads in containers allows us to stay cost efficient and performant while keeping the developer experience approachable and modern.”
—Rob Boll, Engineering Director, Runtime Infrastructure, Datadog

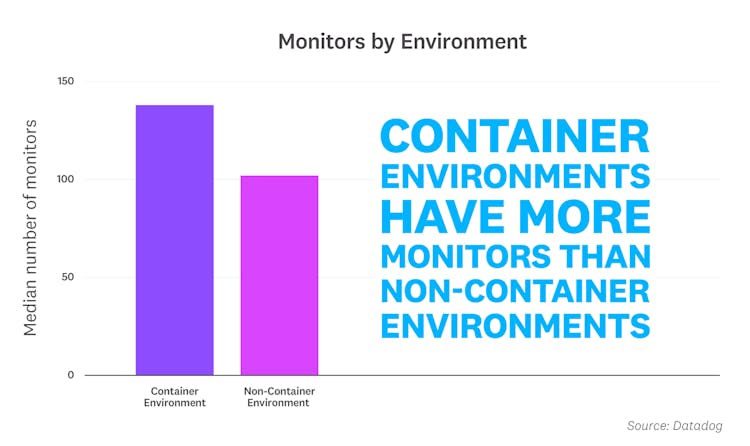
Organizations running container environments create more monitors
Organizations with container environments leverage more monitors than those with non-container environments to alert teams of performance issues in their applications. Container environments are highly dynamic, and setting monitors on ephemeral pods can be impractical, noisy, and even misleading as pod-level issues may not affect overall performance. Shifting that focus to monitoring service-level performance has become a best practice for managing container environments because it helps build infrastructure that is easy to replicate and scale.
The greater number of monitors that organizations are setting up may suggest that they are still tracking the performance of individual pods instead of services. However, with the growth we've seen in Kubernetes adoption in general, along with the rising popularity of tools like autoscalers to optimize Kubernetes infrastructure, we expect that organizations will begin to shift their focus to monitoring service-level performance.

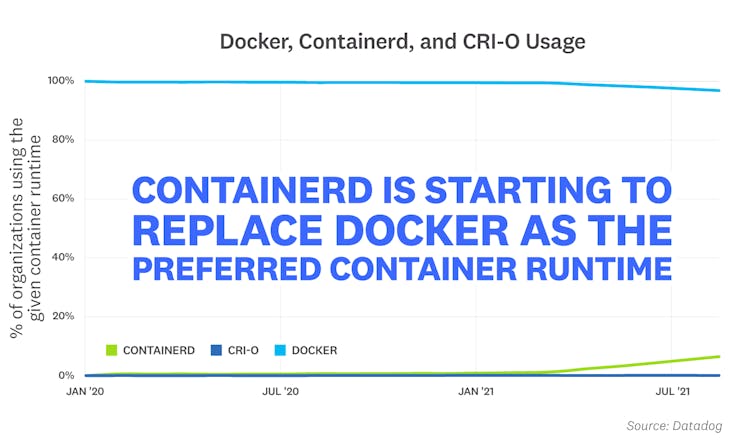
Organizations are starting to replace Docker with containerd as their preferred runtime for Kubernetes
Docker has been instrumental in popularizing containers and has historically been the most popular container runtime for Kubernetes environments. But Kubernetes recently announced that it will deprecate Dockershim—the underlying module that enables compatibility between Docker and Kubernetes—as part of the v1.24 release. This means that organizations will have to migrate from Docker to either containerd or CRI-O, which are the two runtimes that are compatible with the Kubernetes container runtime interface (CRI).
We saw a six percent increase in containerd adoption this year, which is correlated with a dip in Docker usage. These changes started soon after the announcement that Kubernetes would deprecate Docker as a container runtime. There has been little movement in CRI-O, so we expect containerd adoption to only increase over time as more organizations prepare for Kubernetes's v1.24 release.
“We've seen many Kubernetes users migrate to container runtimes other than Docker this year and expect to see an even faster migration rate next year as more adoption blockers are removed. The most common adoption blockers we see today are often caused by third-party apps and tools that still rely on the Docker runtime, but recent adoption numbers indicate that the migration is going well regardless. We've seen Kubernetes focus on providing backward compatibility and a smooth migration experience since it is widely used in production workloads across companies of all sizes—from small startups to enterprises.”
—Sergey Kanzhelev, Staff Software Engineer, GKE, Google

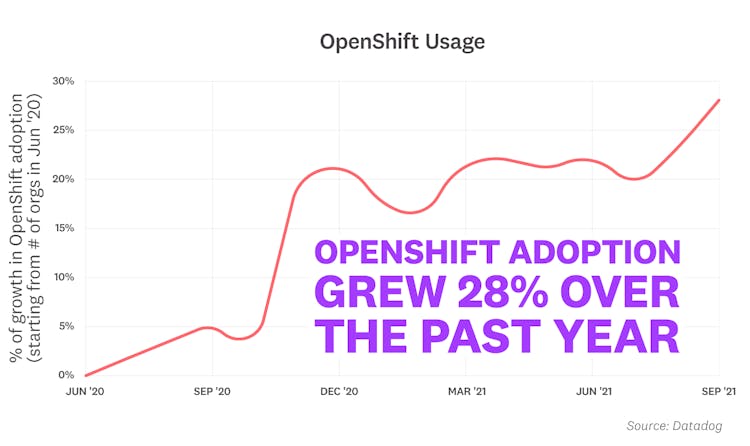
OpenShift adoption is growing rapidly
Red Hat OpenShift is a Kubernetes platform that can be deployed as either a self-managed service or a fully managed service in the cloud. Though OpenShift can be used by organizations of all sizes, it is most popular with large-scale organizations due to its enterprise-grade security, development, and cost-management features. Our data shows a 28-point gain in organizations using OpenShift over the past year. This suggests that organizations that are adopting OpenShift are heavily investing in the ecosystem.
We believe that these findings, taken together with OpenShift's enterprise features, indicate that large-scale organizations are migrating more of their infrastructure to Kubernetes. This shift could also be attributed to OpenShift's comprehensive support for building hybrid cloud environments, which is rising in popularity.
“Datadog's research helps affirm the trends that we are seeing with our joint customers, particularly as they move to a broader application transformation using containers and Kubernetes-powered hybrid cloud platforms. This next wave of transformation now includes modernizing existing applications and building a wide range of new applications—cloud-native, data analytics, AI/ML, ISV, and in-house applications—on Red Hat OpenShift, all while using Datadog's services to bring observability.”
—Lars Herrmann, VP, Partner Ecosystem Products and Technologies, Red Hat

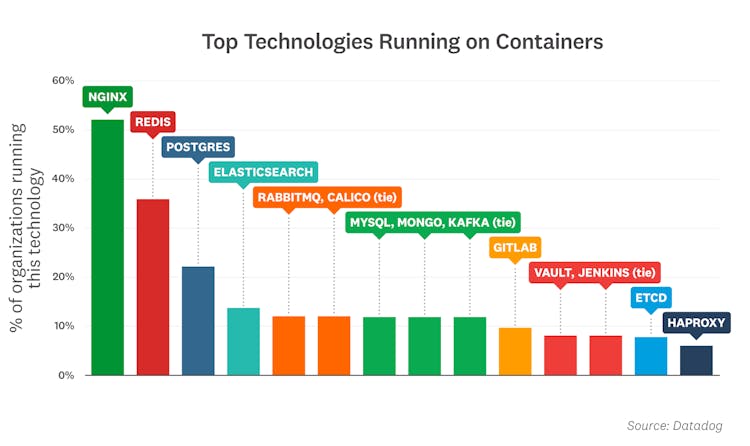
NGINX, Redis, and Postgres are the top three container images
As of October 2021, the most popular off-the-shelf container images are:
- NGINX: NGINX continues its lead as the most popular container image, with over 50 percent of organizations using it in their container environments.
- Redis: This popular key-value data store has been a perennial contender on this list, consistently placing in the top three. Redis is often used as an in-memory database, message queue, or cache.
- Postgres: This open source relational database remains in the top three and has appeared on this list every year since the first iteration of this report.
- Elasticsearch: This distributed data store and full-text search engine continues to be one of the most widely deployed applications in modern container environments.
- RabbitMQ and Calico (tie): RabbitMQ is an open source message broker that finds plenty of use in microservice architectures. Also tied for fifth place is Calico, an open source networking solution. Both technologies edge out MySQL for the first time in this ranking.
- MySQL, MongoDB, and Kafka (tie): The popular open source relational database, document store, and event-streaming platform are tied for sixth place this year.
- GitLab: GitLab is a DevOps platform that enables teams to manage their Git repositories, build CI/CD pipelines, track issues, and more.
- Vault and Jenkins (tie): Jenkins is an open source automation server for creating and managing CI/CD pipelines. Vault, the HashiCorp service for securing and managing access to secrets is also tied for eighth place.
- etcd: The distributed key-value store is used to provide consistent configuration across a Docker cluster.
- HAProxy: The open source proxy is a popular choice for TCP and HTTP load balancing.
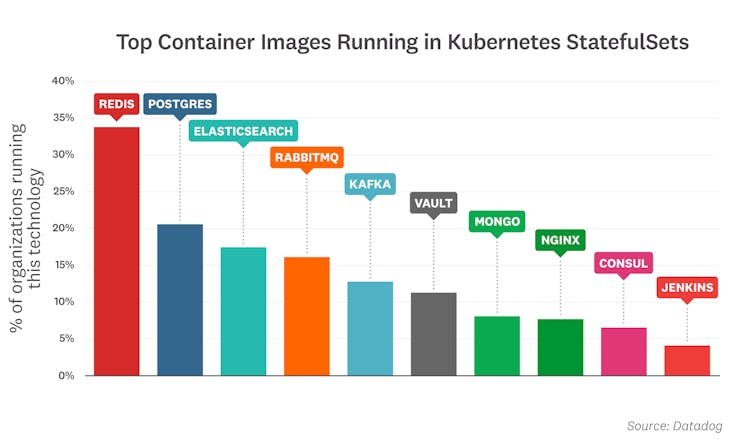
The overall ranking changes slightly for Kubernetes StatefulSets. Redis, Postgres, Elasticsearch, and RabbitMQ are still the most commonly deployed images, but Postgres edges out Elasticsearch for the first time. Jenkins also joins the list for the first time, suggesting that Kubernetes is starting to play a bigger role in supporting CI/CD pipelines.
Sign up to receive container updates
eBooks | Cheatsheets | Product Updates

調査方法
Population
For this report, we compiled usage data from thousands of companies and more than 1.5 billion containers, so we are confident that the trends we have identified are robust. But while Datadog's customers span most industries, and run the gamut from startups to Fortune 100s, they do have some things in common. First, they tend to be serious about software infrastructure and application performance. And they skew toward adoption of cloud platforms and services more than the general population. All the results in this article are biased by the fact that the data comes from our customer base, a large but imperfect sample of the entire global market.
Counting
We excluded the Datadog Agent and Kubernetes pause containers from this investigation.
Fact #9
We sampled a small number of organizations from early 2020 to late 2021. To calculate percentages, we plotted an index chart by making the first month the base month, setting its index to the total number of organizations in that month, and calculating the percentage change for each subsequent month.