November 2020更新 This research builds on previous editions of our container usage report, container orchestration report, and Docker research report.
Containers enable organizations to accelerate delivery cycles and rapidly scale their operations to meet the demands of today's fast-paced market. As more organizations migrate their workloads to containers, the container ecosystem is expanding and evolving to accommodate these increasingly dynamic environments. In this report, we examined more than 1.5 billion containers run by tens of thousands of Datadog customers to understand how image registries, service meshes, networking, and other technologies are being used in real-world container environments.
Orchestration and automation have become an integral part of container deployment and management. Kubernetes now orchestrates half of container environments, and more organizations are turning to managed services like Google Kubernetes Engine (GKE), Amazon Elastic Kubernetes Service (EKS), and Azure Kubernetes Service (AKS) for help with managing the control plane. AWS Fargate, a serverless container management service, also continues to gain traction and is now used in a third of AWS container environments.
Read on for more insights and trends gathered from the latest real-world usage data.

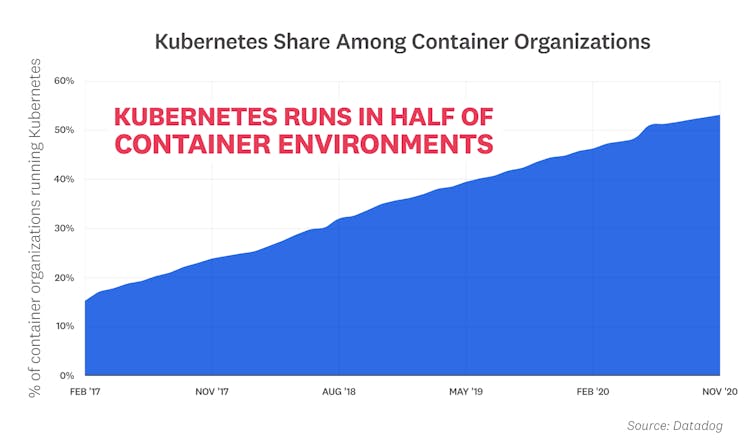
Kubernetes runs in half of container environments
Kubernetes has become the de facto standard for container orchestration. Today, half of organizations running containers use Kubernetes, whether in self-managed clusters, or through a cloud provider service like Google Kubernetes Engine (GKE), Azure Kubernetes Service (AKS), or Amazon Elastic Kubernetes Service (EKS). Kubernetes adoption has more than doubled since 2017, and continues to grow steadily, without any signs of slowing down.
“Cloud native is on the path to ubiquity because of Kubernetes. Datadog's 2020 container report demonstrates the project's robust adoption and is a testament to the hard work of the 50,000+ diverse contributors working on the project. Engineering teams around the world are utilizing Kubernetes and finding new and novel use cases for it. We look forward to more growth in the Kubernetes ecosystem in the coming years with unique use cases in telcos, edge computing, WebAssembly runtimes, and more.”
—Priyanka Sharma, GM, CNCF

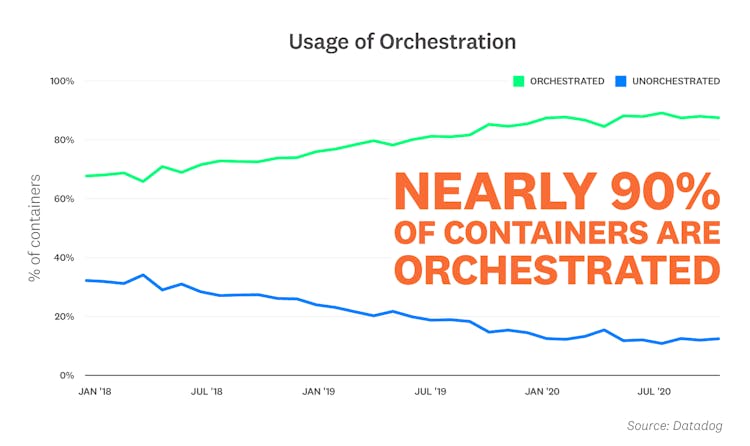
Nearly 90 percent of containers are orchestrated
As container environments grow in size and complexity, orchestration has become increasingly essential for managing these dynamic workloads. By using an orchestrator to automate aspects of container deployment and maintenance, organizations can not only deploy faster, but also ensure that their applications run reliably at scale. Our research indicates that orchestration is now the norm for container environments of all sizes—nearly 90 percent of containers are orchestrated by Kubernetes, Amazon ECS, Mesos, or Nomad.
“Cvent was an early adopter of containers, but it was our migration to ECS that really unlocked the value of the technology. We deliver state of the art products and services for hundreds of mid-sized conferences and for virtual events with tens of thousands of attendees each week. That variation poses unique engineering challenges at scale. ECS allows us to use API-driven orchestration, scheduling, and autoscaling, simplifying our infrastructure management. This allows us to focus on building more creative and impactful experiences for our customers.”
—Brent Montague, Site Reliability Architect, Cvent

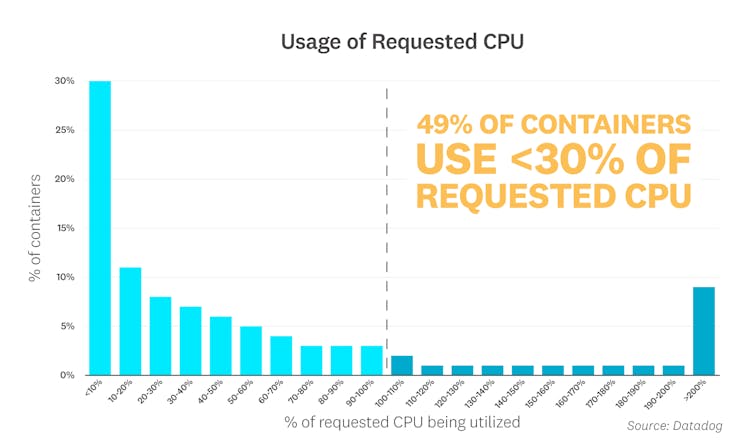
A majority of Kubernetes workloads are underutilizing CPU and memory
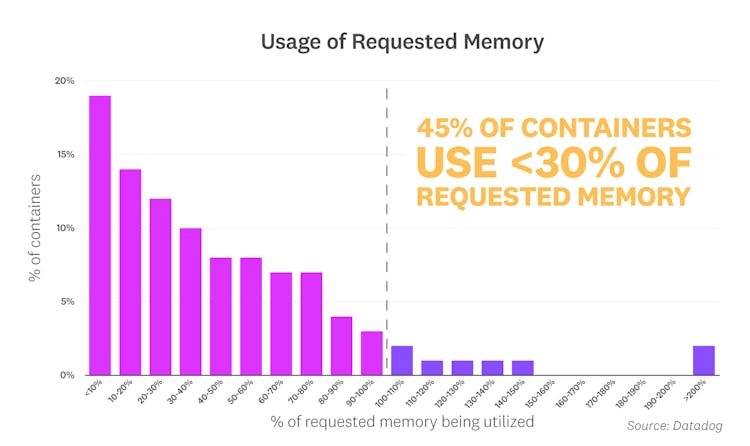
Kubernetes users have the option to specify requests—the minimum amount of resources a pod needs to get scheduled on a node. When it comes to setting requests, striking the right balance between cost and performance is the name of the game. If your pods request more resources than they actually use, Kubernetes won't be able to schedule pods efficiently, leaving costly resources sitting idle. To analyze the extent of this problem, we compared containers' CPU and memory requests with their actual usage, and found that most containers were underutilizing their requested resources.
The graph below indicates that an overwhelming percentage of containers are using less CPU than their defined requests: 49 percent of containers are using less than 30 percent of their requested CPU, and 74 percent of containers are using under 80 percent.
We saw a similar mismatch between memory allocation and usage, with 45 percent of containers using less than 30 percent of their requested memory, and 78 percent of containers using less than 80 percent.
As the data suggests, it can often be challenging to set requests that align with actual usage—especially when you're running volatile workloads. To determine the optimal request size for a pod, you need to consider a few factors, including:
- how much your application's load fluctuates
- how well your application deals with resource starvation
- how fast you can scale up nodes to handle spikes in load
- how much node scale-up delay is acceptable for your use case
Specifying requests that align with actual usage patterns not only ensures that there is sufficient resource capacity to accommodate spikes in load, but can also help Kubernetes schedule pods more efficiently. When implemented across the entire organization, this strategy can lead to massive cost savings each year.

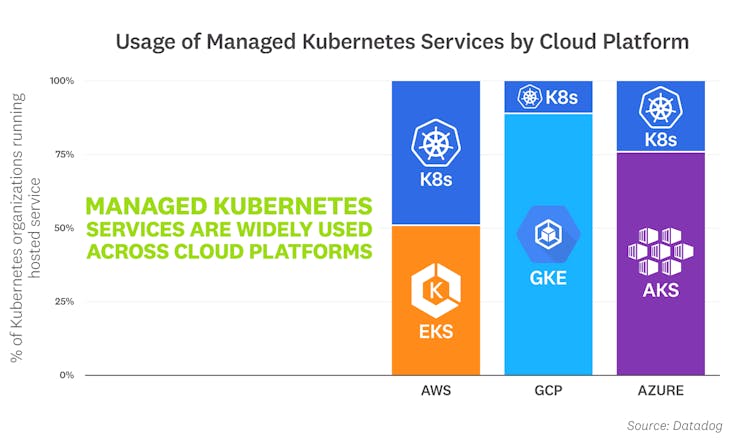
GKE, AKS, and EKS dominate on their respective cloud platforms
As customers continue to adopt Kubernetes, they're also increasingly using managed Kubernetes services, such as Google Kubernetes Engine (GKE), Azure Kubernetes Service (AKS), and Amazon Elastic Kubernetes Service (EKS). GKE, the first managed Kubernetes service on the market, continues to dominate on Google Cloud five years into its release. Roughly 90 percent of organizations running Kubernetes on Google Cloud rely on GKE to manage their increasingly dynamic environments. AKS and EKS, both relatively newer services, have also seen a strong uptick in adoption in recent years. AKS is fast becoming the norm for Kubernetes users on Azure, with two-thirds having adopted it. Meanwhile, EKS is up 10 points from a year ago and continues to climb steadily.
“Datadog's latest container report shows the popularity of public cloud managed Kubernetes services is growing. This is consistent with what we see at Rancher; as our customers mature, they want to be able to implement multi-cloud infrastructures without losing the convenience of a managed control plane. Full lifecycle management across EKS, GKE, and AKS allows our customers to run any application, anywhere, without additional overhead.”
—Sheng Liang, Co-Founder and CEO, Rancher Labs

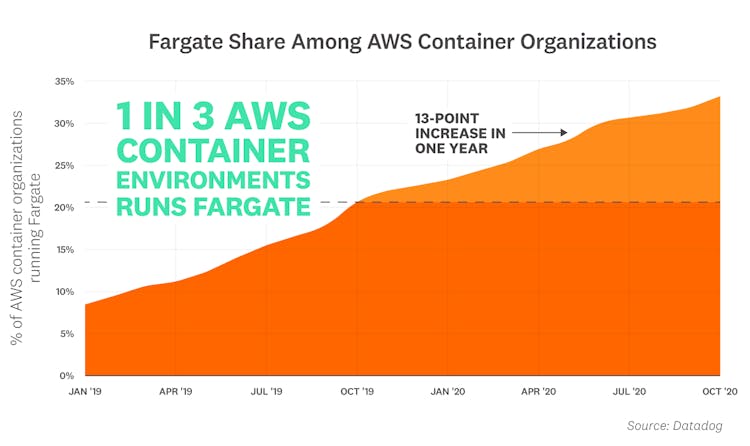
1 in 3 AWS container environments runs Fargate
AWS Fargate is a serverless compute engine that allows customers to run containers at scale, without having to manage the underlying infrastructure. Our research shows that Fargate usage is rising steadily among organizations that run containers in AWS. Today, 32 percent of them use Fargate, up from 19 percent a year ago and 6 percent two years ago. Fargate's rapid development likely contributes to this trend—while it initially only supported Amazon Elastic Container Service (ECS) at launch in 2017, Fargate added support for Amazon Elastic Kubernetes Service (EKS) at the end of last year. With frequent releases of new Fargate features—and strong EKS adoption—we expect Fargate's growth to continue to climb over the coming months.
“AWS Fargate allows us to focus on our business logic and our users’ needs, without compromising on key features such as high availability and security. When we compared Fargate to other serverless options, we found that it provides just the right balance. It gives us the flexibility and the power we need to run all our applications—without placing any limitations on what we can incorporate into our robust architecture.”
—Jonathan Kieliszak, VP Software, Latch

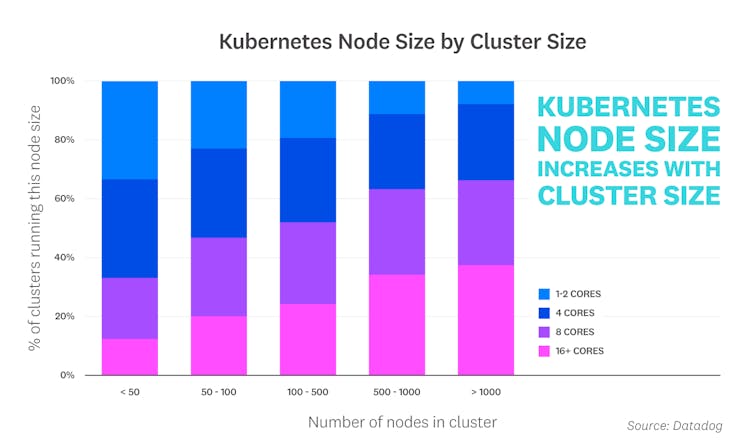
Larger Kubernetes clusters contain larger nodes
In addition to sizing pods' resource requests, selecting the optimal node size for a Kubernetes cluster is another important consideration for optimizing operations costs and application performance. When we looked at data from organizations using Kubernetes, we noted a clear trend: as the size of a cluster increased, smaller nodes were being replaced with larger nodes.
While Kubernetes is designed to be fault tolerant, the failure of a single node—particularly a large node—is likely to pose a more serious problem in a small cluster. Distributing replicas across smaller nodes, rather than packing them on fewer, high-capacity nodes, can help address this concern and improve reliability. However, as cluster size increases, organizations are able to reap several benefits from using larger nodes.
Given the challenges of managing large fleets of replicas across many nodes, our customers could be attempting to limit operational complexity by using larger nodes (saving them the burden of deploying to more nodes than necessary). And because each node needs to allocate some capacity for the operating system and Kubernetes components, consolidating workloads onto larger nodes could help reduce the scale of this overhead—and also reduce load on the Kubernetes control plane, which is responsible for workload scheduling and overall cluster management.
“The ephemeral nature of Kubernetes pod replicas ensures that resources are efficiently utilized at high scale. But finding the optimal node size for a cluster—while weighing in factors like horizontal pod autoscaling (HPA) activity and application deployments—often requires a significant investment of engineering time. GKE's Node Auto Provisioning (NAP) helps teams address this challenge by automatically provisioning the optimal machine type for Kubernetes nodes (based on the current state of deployed applications), which combined with Vertical Pod Autoscaler (VPA) helps minimize infrastructure costs while guaranteeing adequate performance.”
—Jerzy Foryciarz, Senior Product Manager, Google Kubernetes Engine

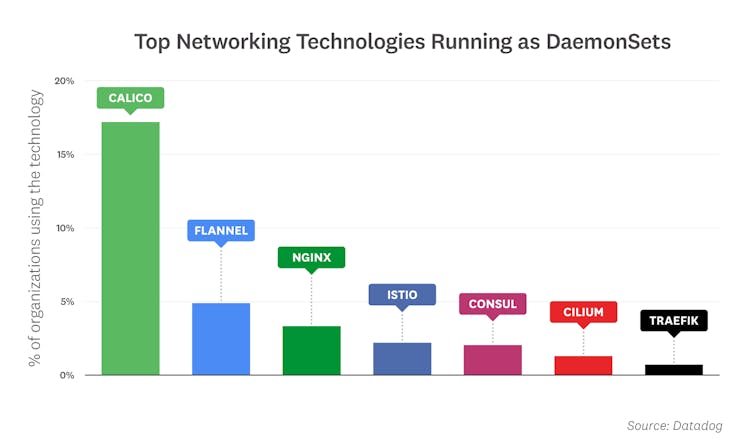
Networking technologies are prevalent among DaemonSets
Kubernetes DaemonSets are often used to roll out node-level utilities—such as monitoring agents, log collectors, and cluster storage—across an entire cluster (or on a specified set of nodes). On average, Datadog customers ran 13 DaemonSets in clusters with 500 or more nodes and five DaemonSets in clusters with fewer than 500 nodes. When we further examined what was running in those DaemonSets, we found that with the exception of monitoring and logging agents, networking and routing technologies were the most popular DaemonSets. Within this category, Calico was by far the most common, followed by Flannel and NGINX. And among organizations running Kubernetes on AWS, the Amazon VPC CNI plugin for Kubernetes was the networking service of choice.
“Since cloud-native networking is a fundamental component of Kubernetes deployments, networking daemons' growth directly correlates with Kubernetes adoption. Networking daemons enable unified service for network controls, network-based security, and observability, which are critical for enterprise applications. Calico's success is a testament to its simplicity, robustness, and ubiquity in on-premises and cloud-based Linux and Windows environments.”
—Ratan Tipirneni, CEO, Tigera

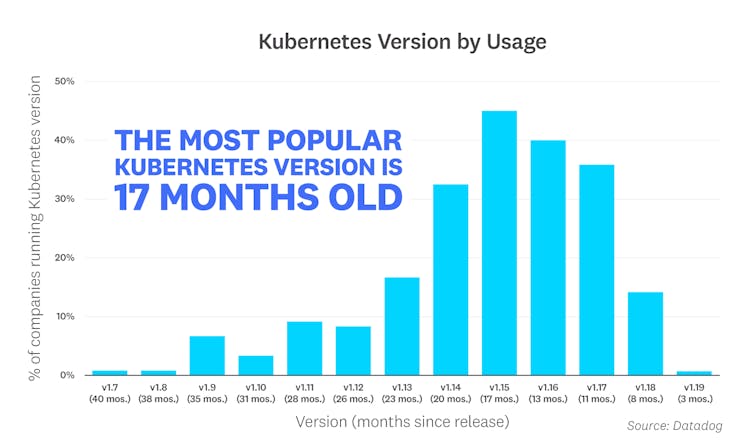
The most popular Kubernetes version is 17 months old
Kubernetes releases a new minor version every quarter, giving users access to new features and enhancements. But in spite of this frequent development cycle, most organizations are still running older, more established versions of Kubernetes. This is consistent with our findings in last year's report, where our research showed that the most popular version in use was v1.13, which was 10 months old at the time. At the time of this report, v1.15 is the most widely used version, even though it was released 17 months ago. Note that since each organization may run several versions of Kubernetes, the percentages in the graph below add up to more than 100 percent.

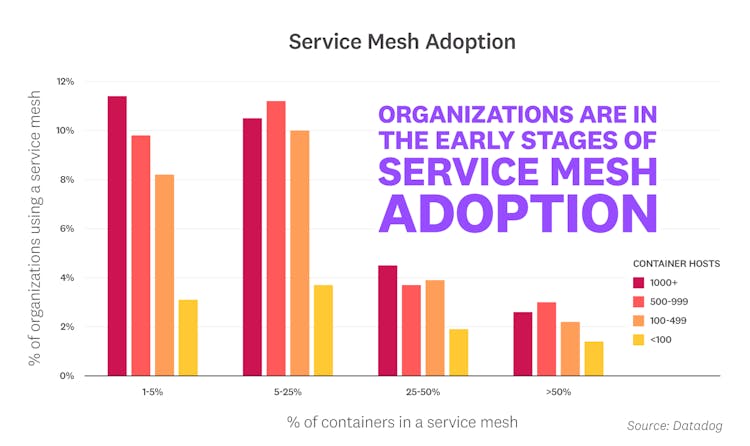
Organizations are in the early stages of service mesh adoption
Service meshes like Istio provide an infrastructure layer that manages communication in a distributed, microservice architecture. To understand the extent to which this emerging technology is being used today, we looked at various levels of service mesh adoption across different container environment sizes. Our findings indicate that most organizations are still early in their service mesh adoption journey, but over a quarter of those with large-scale container footprints have already begun experimenting—likely because they stand to benefit the most from advanced features like multi-cluster networking. Though we have yet to see widespread usage in production environments, we expect adoption to grow over time as the technology matures and container environments become even more complex. See the Methodology section below for details on how we determined service mesh adoption status.
“The 2020 container report reflects the maturity of the Kubernetes ecosystem and also provides transparency into the challenges of managing workloads across a hybrid multi-cloud model. As we look ahead to 2021, we expect that users will increasingly look to evaluate emerging technologies like service meshes and other solutions that can help them address these complexities, ranging from multi-cluster management to security and compliance. Among other opportunities, we also see a growing demand for superior DevOps, enhanced observability solutions, and a continued focus on the speed of innovation and talent.”
—Amr Abdelhalem, SVP Head of Cloud Platforms, Fidelity

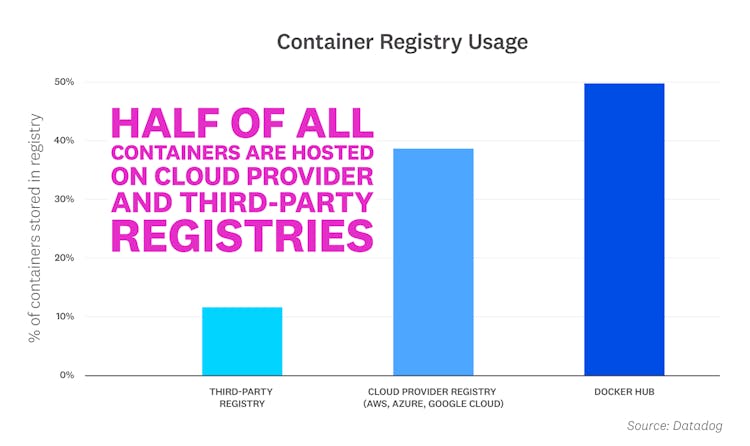
Half of all containers are now managed by cloud provider and third-party registries
Docker Hub has long been the top registry for building and managing container applications. While Docker Hub remains popular, our research shows that half of container images are now hosted in cloud provider-managed registries and third-party registries. Azure Container Registry, Amazon Elastic Container Registry, and Google Container Registry account for 39 percent of images, while third-party registries make up the remaining portion. Among third-party solutions, GitLab Container Registry and JFrog Container Registry lead the way.
We also noted a diverse long tail of third-party registries and hypothesize that organizations are mirroring images from Docker Hub and cloud provider registries into their local, private repositories. This approach helps improve their applications' service level objectives and makes their infrastructure more resilient to registry outages and policies. For instance, Docker Hub recently announced that it would begin rate limiting and shift to a consumption-based subscription model. This change, taken together with the recently released GitHub Container Registry, points to a rapidly evolving public image registry landscape. We are also interested to see how the upcoming AWS public container registry will affect the percentage of images stored in cloud provider-managed registries.
“Today, we run 20 Kubernetes clusters ranging from 50-500 nodes to serve our customers, who span across several continents and time zones. Our autoscaling systems, which directly impact our cutting-edge message sending speed, depend upon the availability of container images. As part of a robust infrastructure strategy that optimizes for availability, we opted to self-host our 2.5 TB of container images due to the dynamic nature of our workloads and our geographically diverse customer base.”
—Andre Banks, DevOps Engineer, Braze

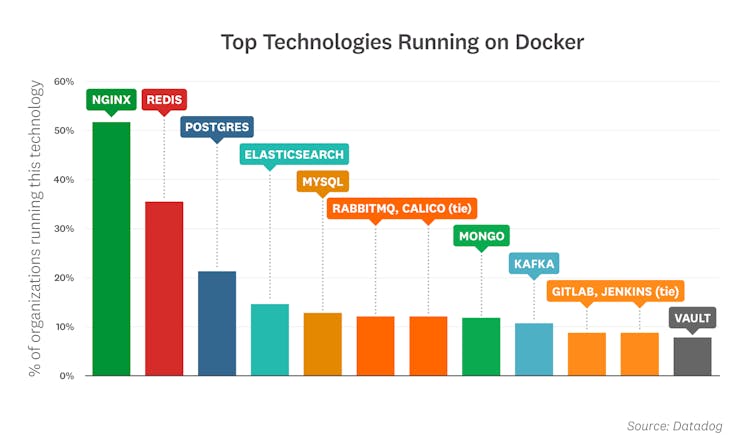
NGINX, Redis, and Postgres are the most popular container images
As of November 2020, the top off-the-shelf images running in containers are:
- NGINX: NGINX has led this list since we started analyzing container image data in 2015—and over the past year, it has continued to extend its commanding lead with a 15-point jump.
- Redis: This popular key-value data store has also consistently placed in the top three. Redis is often used as an in-memory database, message queue, or cache.
- Postgres: This open source relational database has appeared on this list every year since the first iteration of this report.
- Elasticsearch: This distributed data store and full-text search engine remains one of the most widely deployed applications in modern container environments.
- MySQL: This open source relational database continues to be a developer favorite for its ease of use and performance.
- RabbitMQ and Calico (tie): RabbitMQ is an open source message broker that finds plenty of use in microservice architectures. Also tied for sixth place is Calico, an open source networking solution. This marks Calico's first appearance on our leaderboard.
- MongoDB: This widely used document store is the go-to technology for a general-purpose NoSQL database.
- Kafka: This open source distributed event streaming platform is built to handle trillions of messages each day.
- GitLab and Jenkins (tie): These technologies cracked the top 10 for the first time, suggesting that containers increasingly play a critical role in CI/CD pipelines.
- Vault: Built by HashiCorp, Vault is an increasingly popular service for securing and managing access to secrets in dynamic environments.
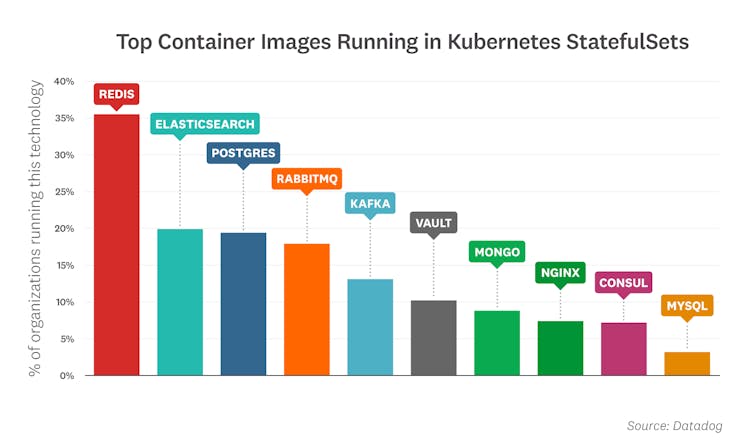
In Kubernetes StatefulSets, we found that Redis, Elasticsearch, Postgres, and RabbitMQ were the most commonly deployed images.
“We have seen growth in all workloads, from both independent software vendors and the broader application ecosystem, on Kubernetes across the spectrum, driven in part by our extensive collaboration with these organizations around Red Hat Operator certification. Kubernetes provides a platform for extensive digital transformation, not just for end users but for vendors retooling their offerings to meet these new challenges. Through deployments from bare metal to the public cloud and now to the network's edge as well as ongoing collaboration in the field, we aim to help our software partners mitigate deployment risks around both existing and containerized workloads while still driving customer success through cloud-native innovation.”
—Ashesh Badani, SVP Cloud Platforms, Red Hat
Sign up to receive container updates
eBooks | Cheatsheets | Product Updates

調査方法
Population
For this report, we compiled usage data from thousands of companies and more than 1.5 billion containers, so we are confident that the trends we have identified are robust. But while Datadog's customers span most industries, and run the gamut from startups to Fortune 100s, they do have some things in common. First, they tend to be serious about software infrastructure and application performance. And they skew toward adoption of cloud platforms and services more than the general population. All the results in this article are biased by the fact that the data comes from our customer base, a large but imperfect sample of the entire global market.
Counting
We excluded the Datadog Agent and Kubernetes pause containers from this investigation.
Fact #3
To analyze under/overutilization of resources for each container, we computed the hourly average of CPU or memory used by the container and divided it by the hourly average of its resource request. We compiled these values for each container over the course of nine consecutive days and graphed them as a distribution, allowing us to generate a representative picture of resource under/overutilization across a diverse set of workloads.
Fact #9
To estimate each organization's service mesh usage, we looked at the percentage of Amazon ECS tasks and Kubernetes pods that ran an Envoy or NGINX sidecar container. We used four thresholds to categorize various degrees of adoption: 1, 5, 25, and 50 percent. Note that the adoption-segmentation thresholds are not derived from a natural grouping within the data; the data covers a continuous spectrum of use. Rather we used numbers that we felt would be intuitively meaningful to our readers. Service meshes that use all other proxies, such as Linkerd, were excluded from this investigation.
Fact #10
Container images without a specified registry domain were assumed to be pulled from Docker Hub.