Why Datadog Was Needed
KT operates a large-scale GPU infrastructure of more than 1,700 GPUs supporting over 60 AI projects. In a hybrid environment spanning Microsoft Azure and on-premises systems, KT must meet diverse requirements ranging from high-performance computing (HPC) to GPU slicing. As the GPU farm grew in size and complexity, KT faced a fundamental question: “Who is using how many GPUs, and where?”
In AI projects, GPUs are critical resources that directly impact research timelines and result quality. Researchers must receive GPU allocations on time, while operators must efficiently allocate and reclaim limited GPU resources when and where they are needed.
Previously, GPU allocation was handled manually and lacked proper oversight. Without objective criteria for GPU reclamation and cost reduction, user dissatisfaction increased. Separate dashboards were required for cloud and on-premises environments, forcing operators to frequently switch contexts and manually correlate information across systems. From the operator’s perspective, limited resources needed to be distributed efficiently, but users’ tendency to secure GPUs first often led to allocations that deviated from policy. It was also difficult to gain visibility into project-level GPU usage and allocation. Obtaining a unified view across environments was challenging, and the burden of manually managing GPU quantities, status, and allocation details continued to grow.
The Problems
KT faced three primary challenges: project-level visibility, integrated monitoring across environments, and large-scale GPU management.
Operators could not view actual allocation and usage at a glance. Because each infrastructure environment used different rules and metadata, such as tags, operators had to switch between multiple screens and manually enter data into Excel. Conflicting GPU allocation priorities sometimes prevented timely resource distribution to teams that needed them.
Operators were forced to check GPU usage separately across environments. In the absence of a systematic and automated operating system, human intervention became a bottleneck in the overall operational process.
Adoption of Datadog for Large-Scale GPU Operations
KT introduced a Datadog-based process to manage GPUs according to standardized operational criteria.
The overall GPU lifecycle was defined in five stages: request, allocation, grouping, monitoring, and reclamation. Requests and allocations were handled by integrating Slack with Datadog. Grouping was performed using Datadog Incident Response and tags. Monitoring and reclamation were managed through Datadog.
A distinctive aspect of KT’s approach was using Datadog Incident Response as the fundamental unit of the GPU operations process. Every GPU-related event begins with the creation of an incident. When a GPU allocation request is submitted via Slack, a Datadog Incident is automatically created. Users enter the project name, organization name, and required GPU quantity, and metadata such as team name, project name, and GPU device information are stored within the incident.
Each incident effectively represents an allocated GPU, and its status reflects the operational stage. The IR number generated by the incident is assigned as a tag to the GPU node, enabling project-level tracking and grouping of nodes by project.
Architecture and Workflow
The GPU operations platform architecture consists of four components: Slack, Datadog, GPUs, and code.
When a researcher submits a GPU request through Slack, a Datadog Incident is created. The generated IR number is delivered to the researcher via Slack notification. The researcher then inserts the assigned IR number at the code or inference level as a tag using the tag API. GPU nodes across cloud and on-premises environments are tracked using tagged IR numbers through the tag API.
Incident statuses are defined as Active, Stable, and Reserved, representing the stages of request, allocation and usage, and project completion, respectively. By reviewing the Incident status list, operators can clearly identify request, allocation, and reclamation stages.
GPU quota management was implemented using Datadog Integrations and the Datadog Agent. GPU quota information from cloud and on-premises environments is automatically synchronized and managed through Datadog Integrations and Incidents. When a new GPU is created in either environment, the Agent automatically detects the node and registers it in Datadog. GPU node names, GPU models, and allocation tags are synchronized in real time within Datadog, allowing operators to immediately review GPU status without manual input.
Datadog functions as a single platform that reflects GPU status across infrastructure environments and supports full automation of GPU quota management and resource tracking.
Leveraging Datadog-Based GPU Monitoring
KT uses Datadog to enable GPU management, GPU governance, environment-level usage visibility, project-level usage visibility, and device- and process-level visibility within GPU nodes.
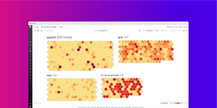
KT’s Datadog dashboards provide intuitive views of GPU usage across multiple environments. GPU utilization metrics are used for monitoring. Nodes are first grouped by project using tags and then grouped by environment. Tags enable flexible grouping tailored to monitoring needs.
Detailed environment-level monitoring supports tracking GPU status in High-Performance Computing (HPC) and GPU slicing cluster environments. In HPC environments, for example, the Datadog Agent periodically collects data such as GPU count per node, utilization, and running job status, and visualizes it on dashboards.
Operators can identify active nodes and the distribution of GPU resources. In GPU slicing environments, where multiple research projects share a single node, the Datadog Agent collects container-level GPU utilization and process data, visualizing resource-sharing status.
Users can review detailed usage information within GPU nodes through Datadog. Dashboards allow operators to verify which processes and jobs are running on GPU nodes, confirm that metrics are properly collected for each connected GPU device, and check for GPU device issues.
Project-level monitoring is also enabled through the Incident structure. Because IR numbers are tagged at the code level, Datadog groups GPU nodes by project using those tags. Operators can view GPU usage scale, average utilization, and usage duration for specific projects at a glance. Based on this visibility, they can analyze GPU efficiency and quickly identify idle or reclaimable GPUs.
“For KT, Datadog is not just a monitoring tool but an operations platform that manages the entire GPU lifecycle. By fully transitioning from people-centric operations to system-centric operations, we were able to upgrade operational efficiency and consistency to the next level.”
Future Plans: Toward Full Automation of GPU Operations
KT plans to expand its use of Datadog from infrastructure operations to model development.
First, KT is reviewing GPU profiling capabilities. The goal is to visualize actual GPU usage data — such as inference latency, memory peaks, and throughput — on Datadog dashboards, enabling developers and operators to share the same data. For example, if supplementary materials such as PyTorch Profiler outputs are uploaded to a webpage, they could be embedded in Datadog dashboards as iframes, allowing GPU resources and model performance to be tracked together.
KT is also reviewing full automation of GPU processes using Datadog Workflow Automation. Build and design history management, which is currently handled manually, will be automated through Workflow and Datadog Integrations, along with automation of Datadog Agent installation.
KT has already automated the removal of tags previously assigned to GPUs and transitioned to a system in which GPU reclamation tasks are designed according to the Incident- and tag-based lifecycle using Datadog Workflow, enabling overall GPU operations to be controlled through code.