At AWS re:Invent earlier this month, we repeatedly heard from AWS users how challenging it was to quickly assess the health of their entire Amazon infrastructure. Particularly in environments with wide fluctuations in demand and auto-scaling deployments of EC2 hosts. As one fellow engineer we spoke to put it,
“The first thing I want to see in the morning is whether there are any hot spots in my environment, and if so, where. Right now, figuring that out can take an hour or more”.
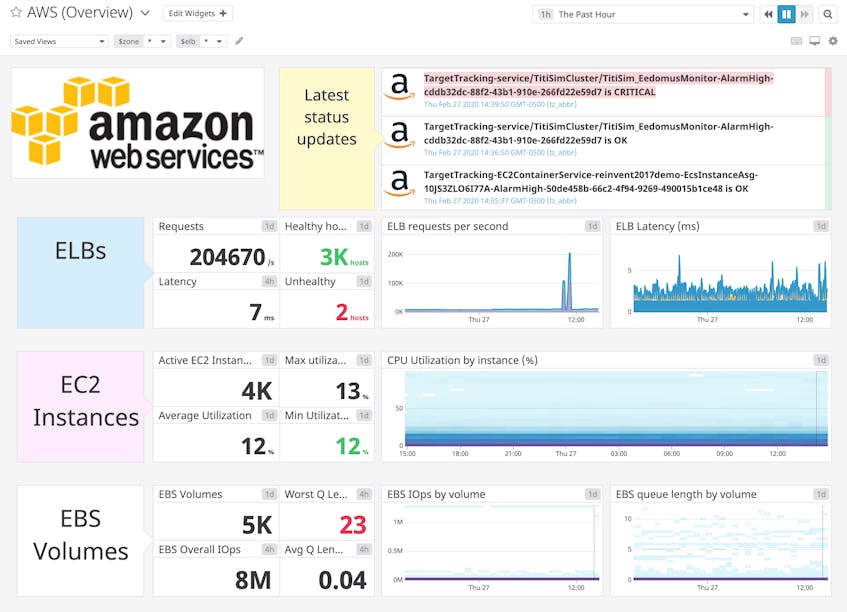
Hot on the heels of repeatedly hearing the same frustrations, we are happy to announce the new AWS Overview Screenboard. Now you can, at a glance, assess the health of your entire AWS infrastructure. This Screenboard becomes active as soon as you enable the AWS integration in Datadog, and is available with a free trial of Datadog.
Why a new Screenboard?
This AWS Overview Screenboard serves 2 purposes:
- To give you a 30,000-foot overview of your AWS infrastructure and help you decide in an instant whether you need to investigate more.
- To give you a fully-functional Screenboard you can customize in a very intuitive way.
A 30,000-foot overview of your AWS infrastructure
We have been providing you with a number of out-of-the-box Screenboards for monitoring EC2, EBS and ELB. The AWS Overview Screenboard is different: It oversees the major components of your AWS environment all at once.
Looking at this 30,000-foot view you can immediately and very visually find the hot spots and identify the service that requires your attention.
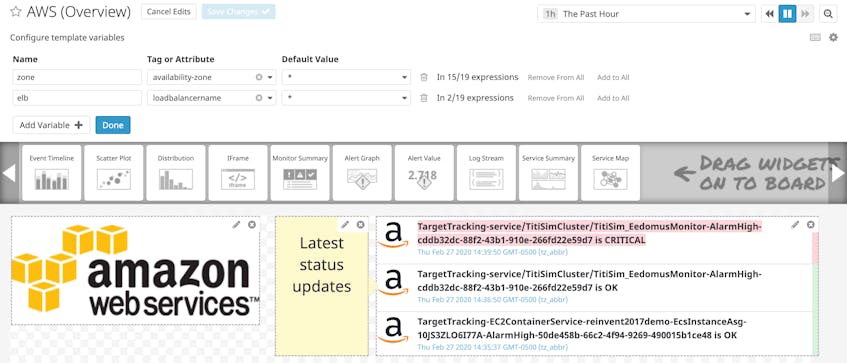
You can also “slice and dice” the various metrics in the overview by availability zone or per ELB using template variables ($zone and $elb).
The new Screenboard is just a starting point
Once you have found the new AWS Overview Screenboard, you can modify it as you see fit. And this is where it gets even more powerful. By clicking on “Edit” and adding widgets, adding template variables, changing colors, sizes and annotations, you can pull metrics from your entire stack in one place.
With that, you can grok the data quickly and customize views for a number of different teams or users that work off the same AWS environment.
You can gain access to this Screenboard in just a few minutes by signing up for a free trial.


