Ivan Ilichev

Jesse Mack
Processes—the service workloads that run on your infrastructure—are the building blocks of your application, and it’s critical to know how well they operate at every level of the stack. Degraded process performance can lead to downtime for your mission-critical services, resulting in loss of customer trust and potentially impacting revenue for the business. This makes it essential to identify anomalous performance trends early, so teams can quickly investigate and resolve them before their impact spreads.
Watchdog Insights and Alerts, now available for Datadog Live Processes, help you easily surface detailed information about anomalous workload behavior. These insights enhance your understanding of workload performance and enable you to identify ongoing issues so you can prevent or remediate them.
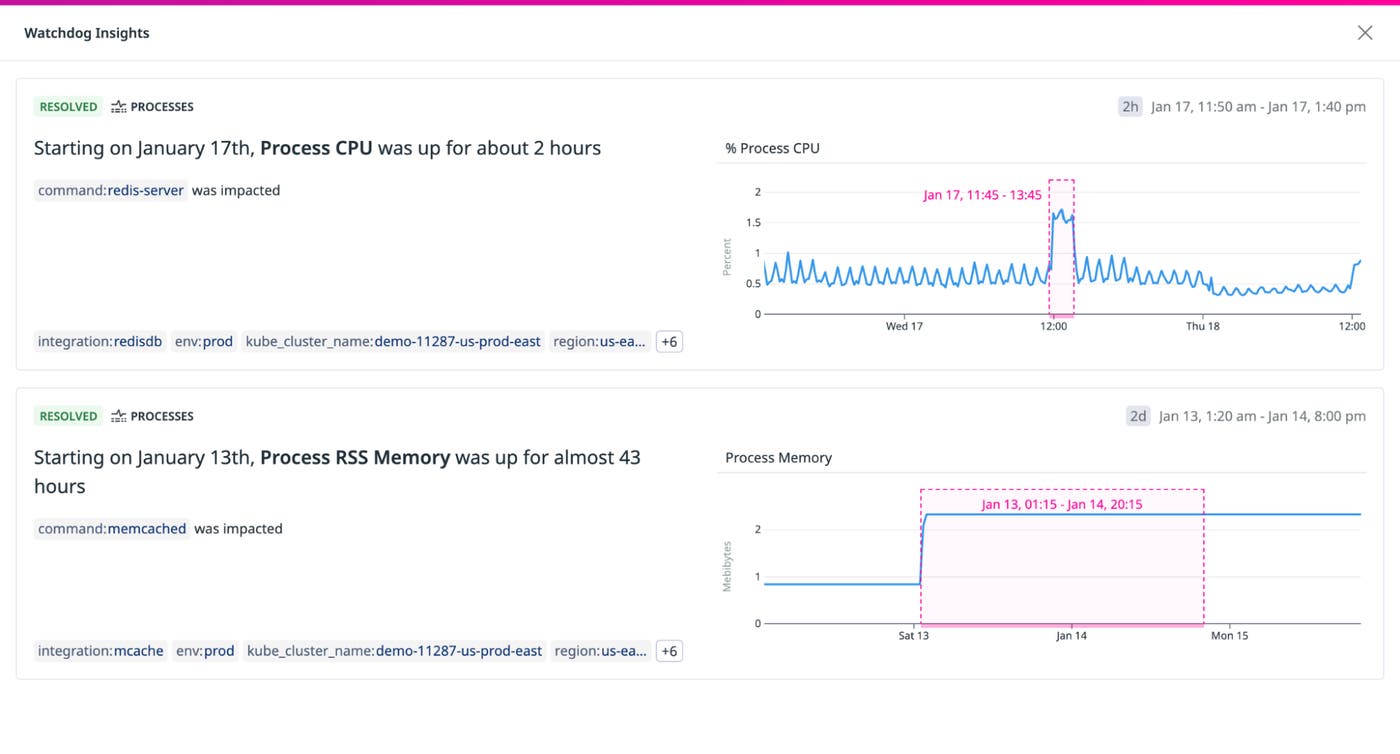
In this post, we’ll show you how to:
- Use Watchdog stories to identify anomalous performance trends in your processes
- Troubleshoot workload performance issues surfaced by Watchdog
Use Watchdog stories to identify anomalous performance trends in your processes
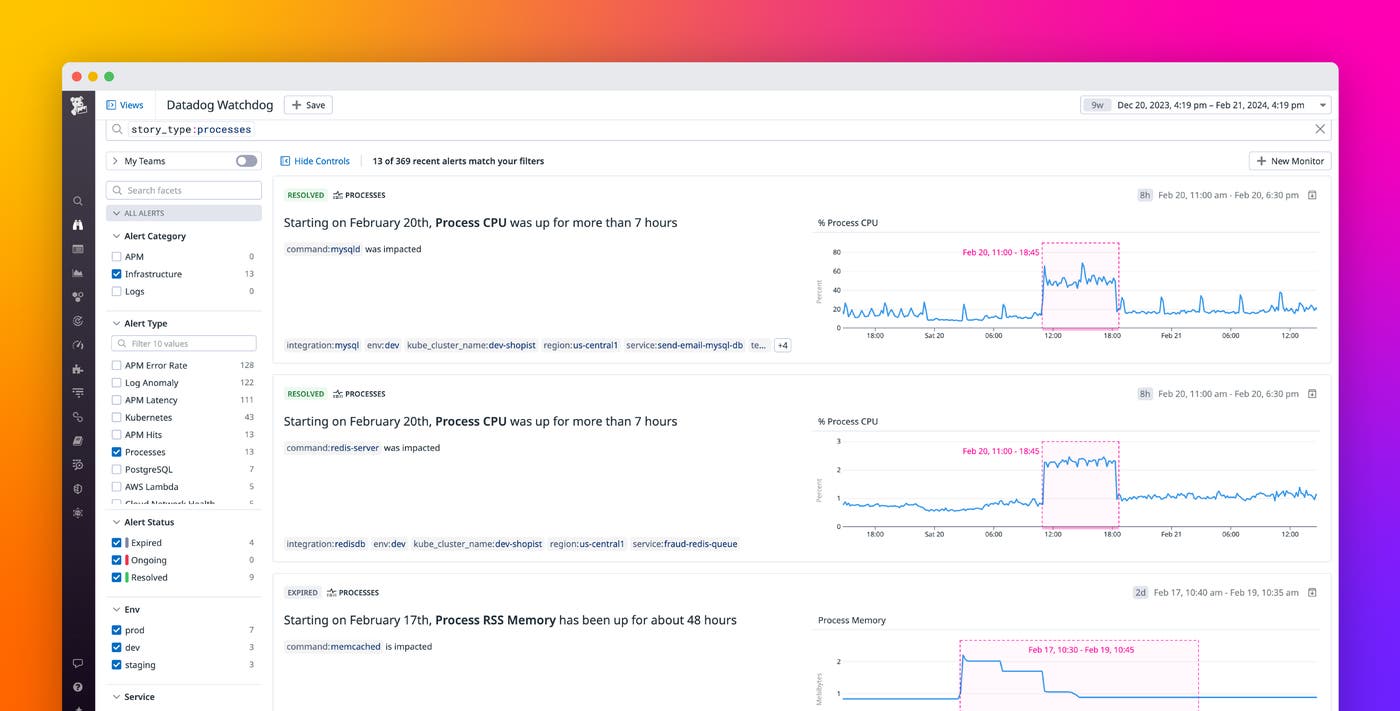
Watchdog Insights for Live Processes generates stories specifically tailored for process-level issues—such as memory or CPU anomalies—in common open source integrations like Redis, Elasticsearch, NGINX, Kafka, and many more. Watchdog surfaces a story when it detects a process consuming an abnormal amount of CPU or RSS memory compared to past performance, or to how similar processes have behaved in the given infrastructure group. Stories will automatically populate based on your current search criteria, so you can easily identify performance anomalies that are relevant to the processes you’re currently viewing.
Each Watchdog story includes service, environment, and other tags to help you understand the scope of the problem within your infrastructure. The detail side panel also highlights the time frame of the anomaly to provide a starting point for investigations into root cause and impact.
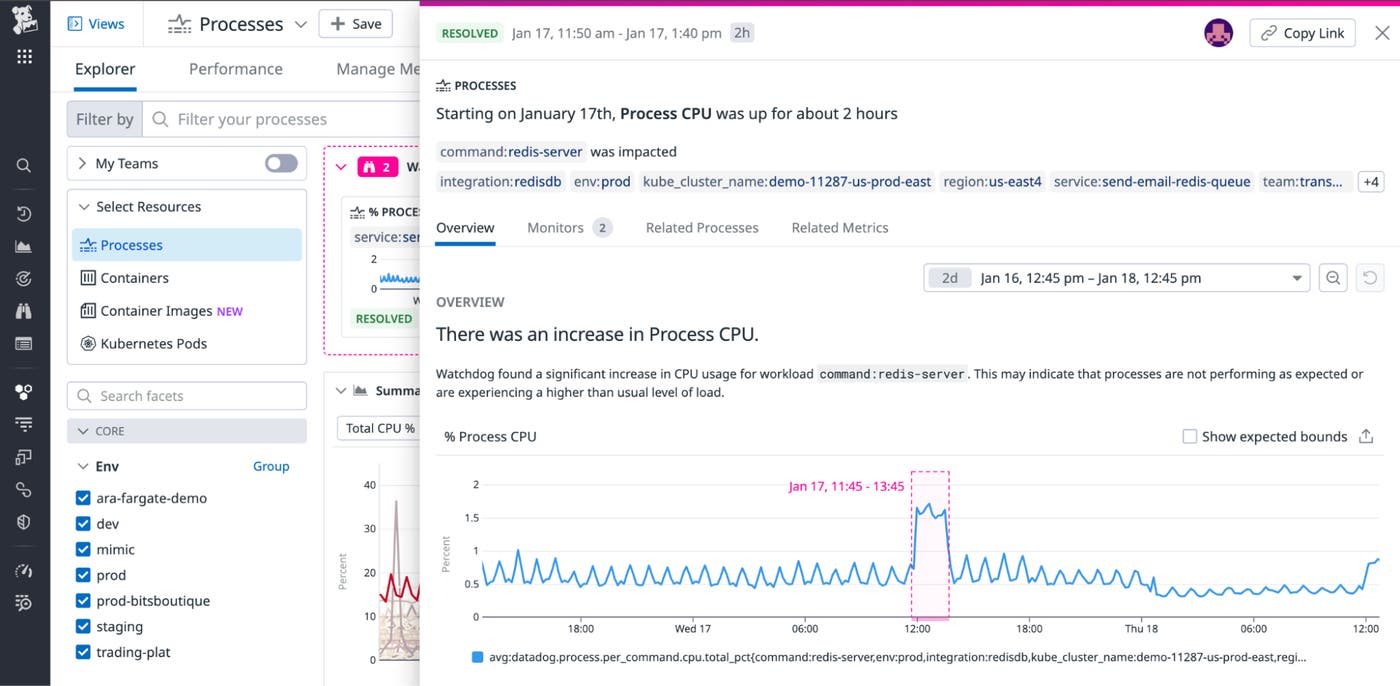
Troubleshoot performance issues surfaced by Watchdog
To further aid your investigations, Watchdog stories provide a wealth of additional telemetry related to the issue you’re viewing. By navigating to the Related Metrics tab, you can easily view the most relevant metrics for the affected process. This data helps you troubleshoot the issue by providing context into infrastructure performance that could impact the workload you’re investigating.
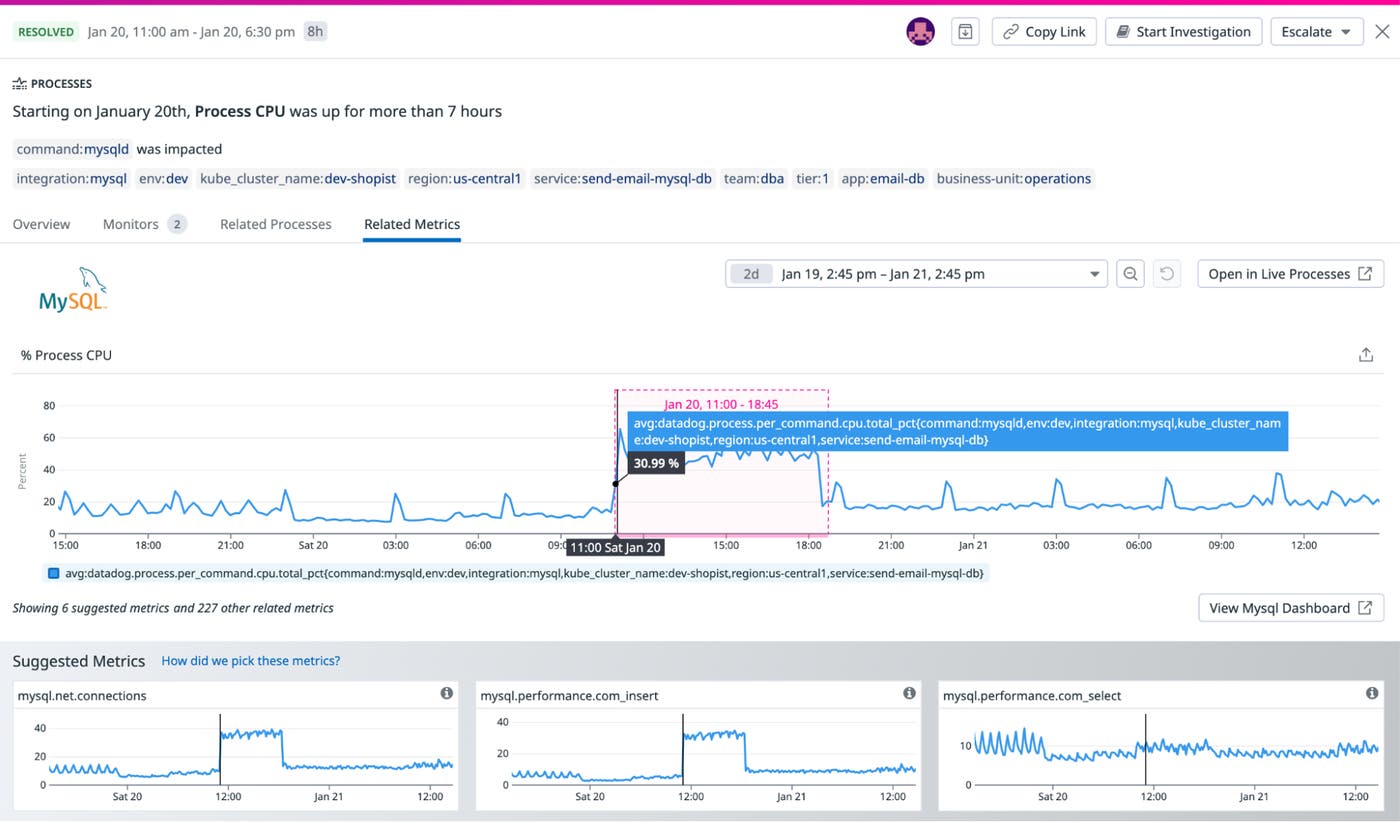
In the above screenshot, for example, we can see an increase in both connection volume and the rate of insert statements around the same time that Watchdog detected a spike in MySQL process CPU, suggesting that an increase in client requests may have caused the performance anomaly.
If you need to troubleshoot further, you can use the Related Processes tab in the Watchdog story to see each individual process associated with the finding, alongside details such as CPU utilization, memory usage, and what host the process is running on.
From there, you can pivot to the Processes view to see more details, metrics, and metadata that can help you gain further insight into process performance. You can also pivot to Datadog Infrastructure Monitoring to see more information about the relevant parts of your infrastructure—whether you are running your workloads in containers, on bare metal hosts, or on serverless compute platforms such as AWS Fargate.
Gain insight into anomalies in process-level performance
Ensuring application processes are running efficiently and as expected is critical for the maintenance and uptime of your services. Watchdog Insights and Alerts for Live Processes quickly surface concerning trends in service workload performance that may require remediation. They also provide the contextual information and metrics from the related components of your infrastructure to help you expedite troubleshooting and quickly resolve the issue.
Watchdog Insights and Alerts are available for all Live Processes customers. For more information, see our documentation to enable Live Processes for your infrastructure. If you’re not using Datadog yet, sign up for a 14-day free trial.
