
In Part 1 of this series, we discussed key VMware vSphere metrics you can monitor to help ensure the health and performance of your virtual environment. In this post, we’ll cover how you can access these key vSphere metrics using a few of VMware’s internal monitoring tools. We’ll also show you how and where to access VMware events and logs to help you gain further insight into your virtual environment.
VMware vSphere collects data on the performance and resource usage of inventory objects and archives it in a database on the vCenter Server database. Inventory objects are any physical or virtual components of your environment that can be monitored and alerted on, including virtual machines, ESXi hosts, clusters, and resource pools.
vSphere has built-in tools that allow you to quickly access monitoring data. In this post, we’ll be covering two primary tools for accessing metrics from vSphere so that you can gain insight into the inventory objects that make up your virtual environment. We will look at how to:
- use the vSphere Client to visualize and set alarms on key metrics and logs from your environment
- view real-time data from your ESXi hypervisors with vSphere’s esxtop command-line tool
We’ll also take a look at how to configure vSphere to use a syslog forwarder to enable you to send logs to an external log management tool for long-term storage and analysis.
vSphere data collection intervals and levels
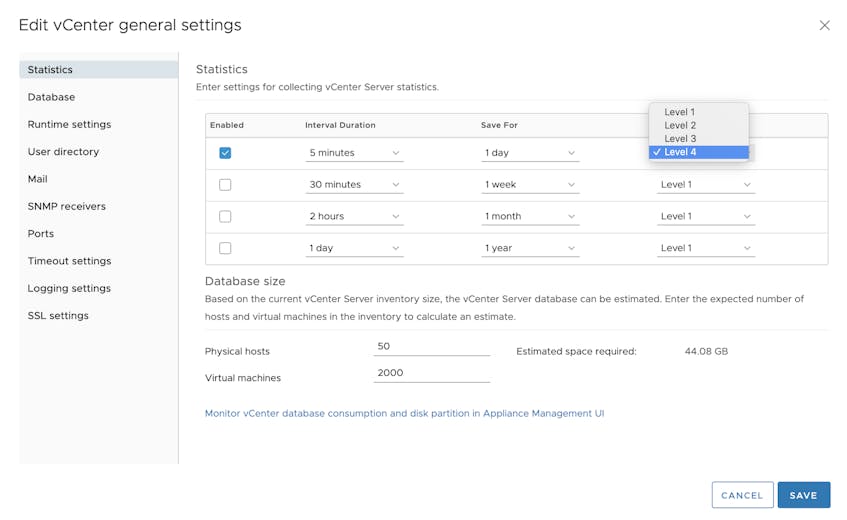
A large vSphere environment emits a lot of monitoring data. To prevent overloading your vCenter Server’s database, you can control the volume of data vSphere collects and the amount of time that data is retained by setting data collection intervals and data collection levels.
Data collection intervals
Data collection intervals define how frequently monitoring data is collected (i.e., its granularity) and how long it remains archived. By default, collection intervals are set as follows:
| Collection Interval | Frequency | Retention |
|---|---|---|
| 1 Day | Data points are collected every 5 minutes | 24 hours |
| 1 week | Data points are collected every 30 minutes | 1 week |
| 1 month | Data points are collected every 2 hours | 1 month |
| 1 year | Data points are collected every 24 hours | 1 year |
Data collection levels
There are four data collection levels (Level 1 to 4). Each collection level defines how much monitoring data vSphere will collect at each collection interval. By default, collection intervals collect Level 1 metrics, which include basic overview data such as virtual machine CPU usage and disk latency. Each subsequent collection level includes all the metrics of the level preceding it along with additional data. For example, Collection Level 4 includes all the metrics available at Collection Levels 1, 2, and 3, as well as minimum and maximum rollup values (e.g., maximum CPU and memory usage). You can view vSphere documentation for a full list of available metrics and which collection level makes them available.
Use the vSphere Client to monitor your environment
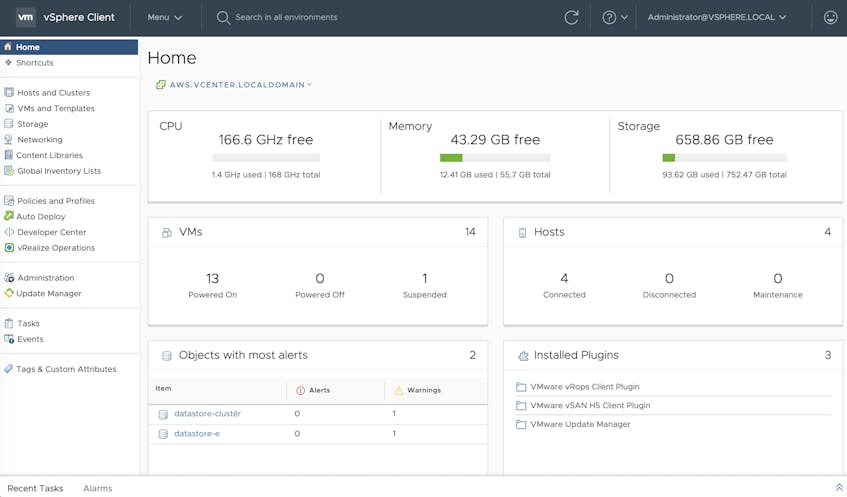
Administrators can access all of the data collected by vSphere through the vSphere Client. The vSphere Client is a web browser–based application that connects to and lets users interact with the vCenter Server. The vSphere Client enables you to monitor your virtual environment by letting you:
- visualize key metrics with performance charts
- set alarms on your metrics
- view tasks and events
- export logs
The vSphere Client is automatically included when you provision a vCenter Server, so no additional installation is required. To log in to the vCenter Server with the vSphere Client, open a web browser and enter the URL of the vCenter Server instance you want to view data for (i.e., https://<domain_name>). On the resulting page, select “Launch vSphere Client.” Then, you can log in with your credentials.
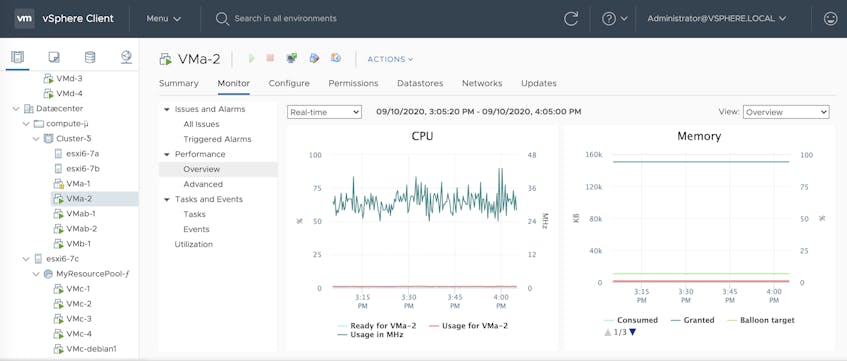
Visualize key metrics with performance charts
The vSphere Client displays health and performance data of your inventory objects in the form of performance charts. Inventory objects have two types of performance charts in vSphere: overview charts and advanced charts. An inventory object’s overview charts provides summaries of its key metrics (e.g., CPU usage, consumed memory, and disk I/O).
Advanced charts can be customized so that administrators can add additional metrics that are not included in overview charts. For example, you can set your own time span to monitor, decide which metrics to display, and what chart types to use. You can can also export the data in advanced charts to external files or spreadsheets.
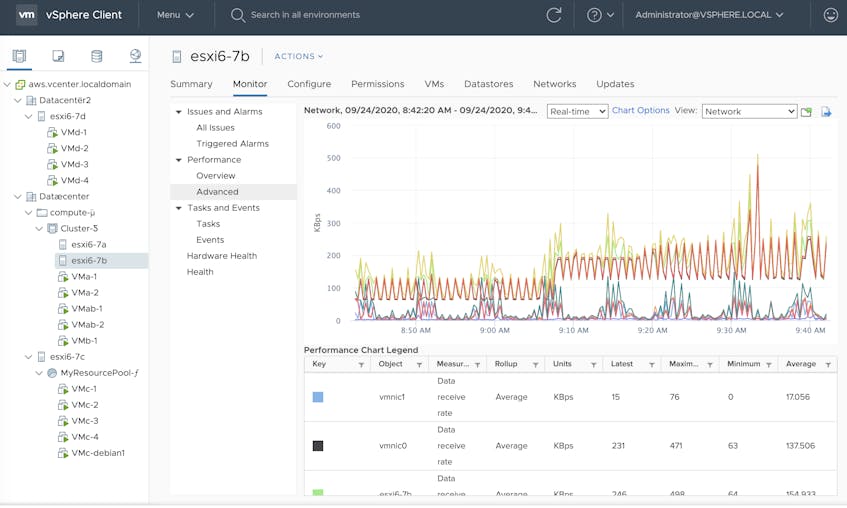
To view performance charts, select one of the inventory objects listed on the left sidebar. Then, navigate to the “Monitor” tab and click “Performance” and select either “Overview” or “Advanced.” By default, both overview and advanced charts display real-time data collected in 20-second intervals over the past hour. You can view different intervals you’ve enabled (e.g., over the last day, week, month, etc.) with the interval dropdown menu above your performance charts.
Depending on what inventory object you’re observing, both overview and advanced performance charts have a set of different available views. Each view includes different key metric categories for that particular object. For example, if you are looking at the performance charts of an ESXi host you can select either the “Home” view, which displays its key resource metrics, or the “Virtual Machines” view, which provides a breakdown of the 10 virtual machines running on that host with the highest CPU, memory, disk, and network usage.
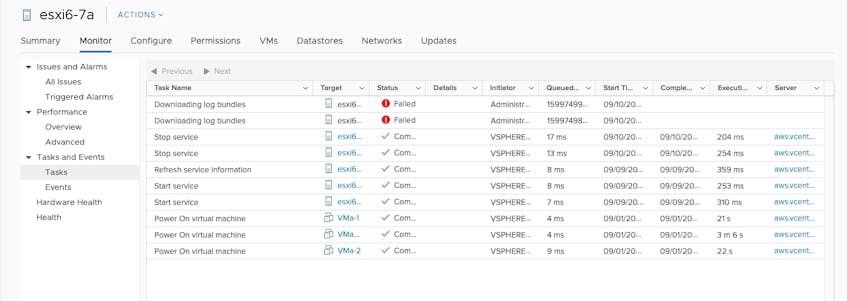
View vSphere tasks and events
In addition to monitoring key metrics from your vSphere environment, you can also use the vSphere Client to monitor the activity of your ESXi hosts and VMs through tasks and events. Events include activity such as user logins and powering on VMs, as well as configuration changes like enabling or disabling SSH access to an ESXi host. Tasks are actions in your vSphere environment that can be scheduled, such as VM migrations and adding ESXi hosts to an existing cluster.
To view the tasks and events associated with an inventory object, select an object listed in the vSphere Client, navigate to the “Monitor” tab, and click “Tasks and Events” in the left sidebar. The vSphere Client’s Tasks and Events list includes the names of tasks and events, when they were executed, their status, and which user triggered them.
Set alarms on your metrics
Instead of manually monitoring all of your data to look for signs of a problem, you can also use the vSphere Client to set alarms to automatically notify you if an issue occurs in your environment. Alarms can be set to trigger on capacity and resource conditions (e.g., if an ESXi host’s memory usage exceeds a specific threshold), as well as events (e.g., when a host loses network connectivity).
To set an alarm with the vSphere client, right click on an inventory object and, under “Alarms,” select “New Alarm Definition,” where you’ll be prompted to define which thresholds or events will trigger the alarm.
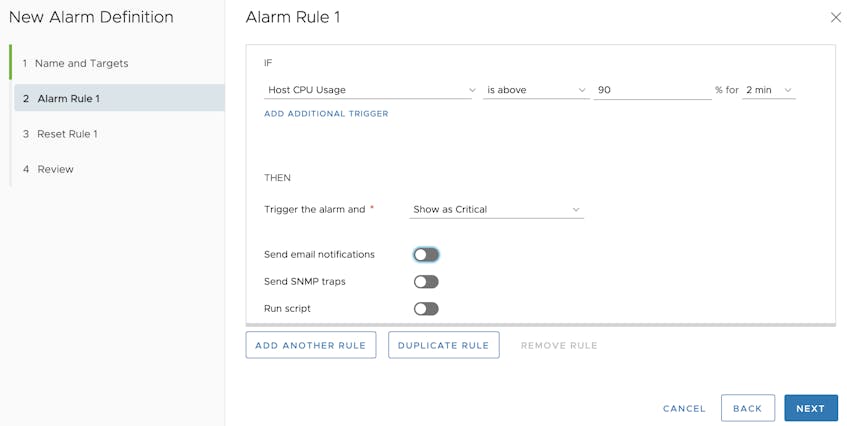
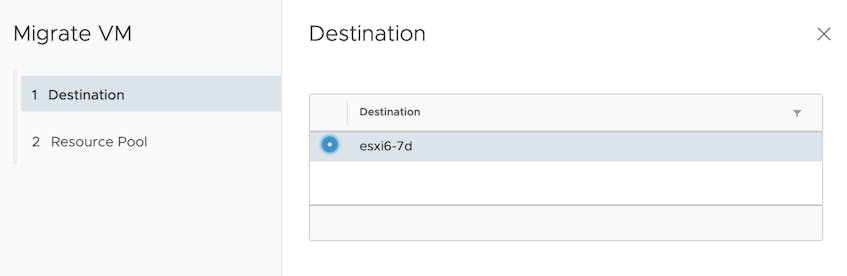
You can also configure your alarms to perform alarm actions. Alarm actions include things like migrating VMs and sending notifications to specific people or teams. For example, if an alarm is triggered after a virtual machine fails to migrate to another host, as shown in the image below, you can set a subsequent vCenter Server action to send an email to notify the rest of your team.
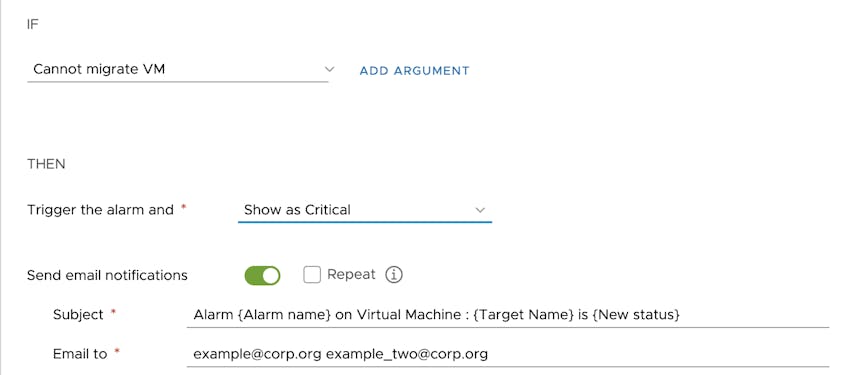
You can also configure the vCenter Server to initiate a VM migration if its memory usage surpasses a high threshold for an extended period of time (e.g., over 90 percent memory usage for 5 minutes).
Export logs from the vSphere Client
Your ESXi hosts emit logs that provide insight into activity within your virtual environment that can help you perform audits and troubleshoot issues. In Part 1 of this series, we looked at where vSphere stores log files. With the vSphere Client, you can export logs from your inventory objects into a .zip file in order to centralize them in a single location.
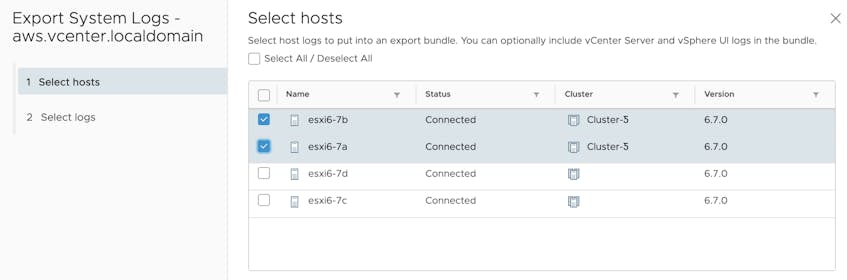
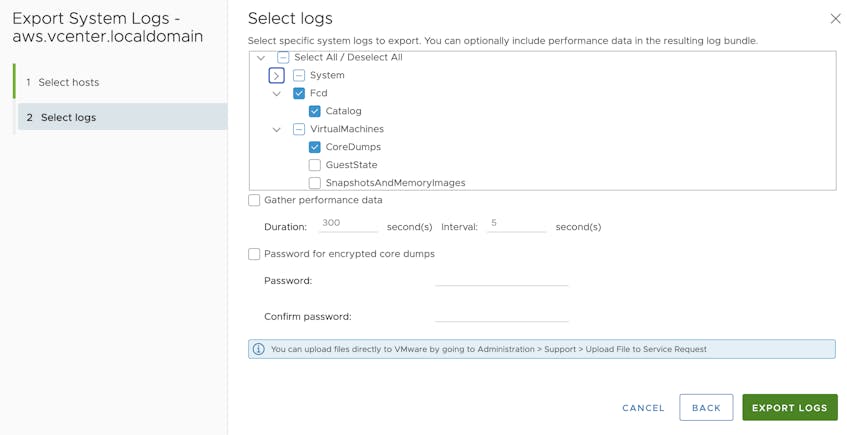
To export logs, log in to the vSphere Client, right click on a vCenter Server listed in the left sidebar, and select Export System Logs. From here, select which hosts to export logs from and the types of logs you want to view (i.e., VM-related logs, hardware logs, configuration logs, etc.). VSphere also gives you the option of selecting “Gather performance data,” so that performance data reported by ESXi hosts (including the key metrics covered in Part 1) during a specified interval of time will be bundled together along with your exported logs.
After you’ve decided which logs to export and clicked “Export Logs,” specify where you’d like your log files to be saved. vSphere will then bundle log files together into a .zip file that you can then export and share as you troubleshoot your environment.
Later in this post, we’ll also look at how you can configure vSphere to use a syslog forwarder to send logs to a centralized log management service like Datadog.
Monitor ESXi hypervisors with esxtop
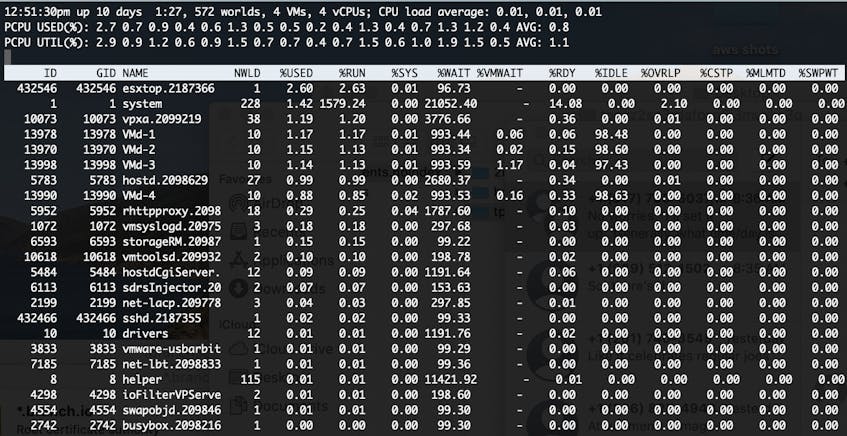
VSphere’s performance charts are useful for visualizing performance data, but the shortest interval they can collect real-time data in is 20 seconds. To monitor VMs and hosts with more granularity, you can use esxtop, a command line tool that allows vSphere administrators to view resource, health, and performance metrics of virtual machines and ESXi hosts, with sampling intervals as short as two seconds.
VMware also has a tool called resxtop available for Linux users, which has similar functionality as esxtop with a few key differences, including that the resxtoputility can be used to access an ESXi host remotely, while esxtop can only do so through a host’s secure shell. To access a server with resxtop, you can use a command like the following:
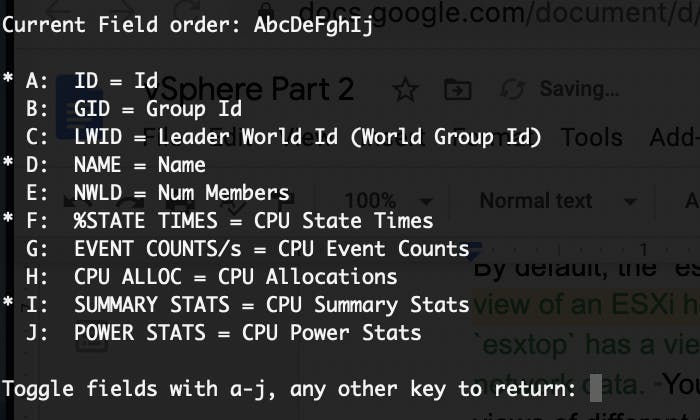
resxtop --server example.vcenter.server --username vsphere_administrator To use esxtop you need to enable SSH access to your ESXi hosts’ shells, which allows you to interact with individual hosts through the command line. Once you’ve logged in to a host’s shell, you can type esxtop to start the utility. By default, esxtop will open in the CPU view of its Interactive Mode (discussed below) resulting in the following view:
The esxtop utility has three modes: Interactive, Batch, and Replay.
Interactive Mode
By default, the esxtop utility opens in Interactive Mode, which returns a view of an ESXi host’s performance data that updates in real time. From here, you can toggle between available views of different metric types including CPU, memory, disk, and network. For example, typing c returns CPU metrics, m returns memory metrics, and d returns disk metrics. Once you’ve selected a set of metrics to view, you can customize which columns to display by typing f. This gives you a full list of fields you can choose to either include or remove from your view.
Batch Mode
Batch Mode lets you save performance and resource usage data to a .csv file for later analysis. To use Batch Mode, use the -b flag when launching esxtop and specify the name of the file where you want your data to be saved.
esxtop -b > example_file.csvWhen using esxtop in Batch Mode, you cannot perform interactive tasks (e.g., switching displays, updating metrics, etc.). Instead, as esxtop runs, it will collect and save real-time data to the specified file. You can specify what data should be collected by first running esxtop in Interactive Mode, selecting what columns you want saved (with the -f flag), and saving that configuration by typing W. Then, when you next run esxtop in Batch Mode, you will collect data only from those columns.
By default, esxtop runs until you exit the utility, but in Batch Mode you can also tell esxtop how many times to collect data before exiting by including an -n flag after the esxtop command, followed by the number of times you want data collected. You can also specify the data collection interval with the -d flag, which has a default value of five seconds. For example, the following command starts esxtop in Batch Mode and writes data to a file named example_file.csv 10 times at two-second intervals before quitting:
esxtop -b -d 2 -n 10 > example_file.csvReplay Mode
Note that resxtop does not support this mode. Replay Mode enables you to reproduce past performance and resource usage data. Before you can run esxtop in Replay Mode, you’ll need to run vm-support, a separate command line tool. The vm-support tool records the state of your virtual environment by collecting a series of diagnostic logs, called “performance snapshots,” from various inventory objects like VMs and ESXi hosts and bundles them together into a .tgz file. Together, vm-support and Replay Mode enable you to record data within a specified period of time and then explore that data using a CLI for further analysis.
When running vm-support, use the -d and -i flags to define the length of time in seconds it will run and how long to wait between each snapshot. The following example runs vm-support for five minutes and takes 10 snapshots.
vm-support -d 300 -i 10 By default, vm-support saves bundled snapshots under a host’s /var/tmp/ directory. You can redirect vm-support output by using the -w flag followed by a specified location.
After you’ve bundled and saved your snapshots, you can run esxtop in Replay Mode by using the -R flag and specifying the path to the directory where vm-support saved the snapshots of your environment.
esxtop -R /var/tmp/bundled_snapshot.tgzNow you will be able to explore past performance data in esxtop as though you were in Interactive Mode.
Configure ESXi host and vCenter Server log forwarding
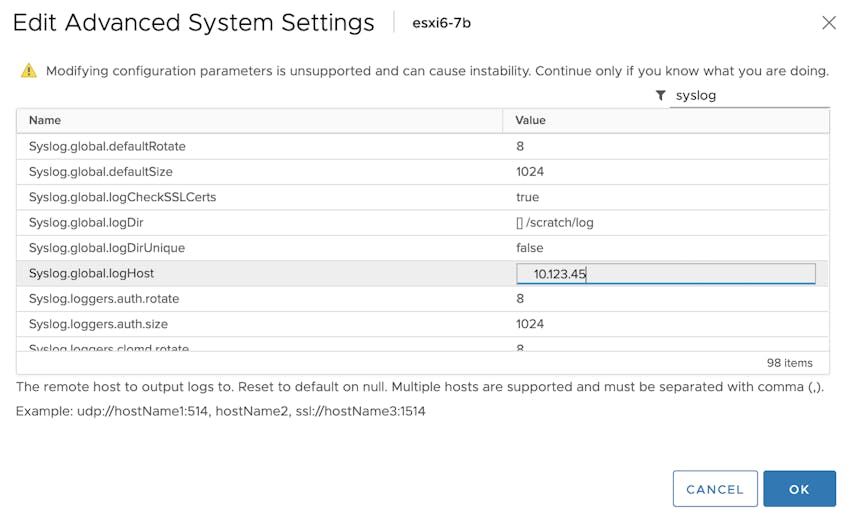
We’ve seen how you can export logs from your environment through the vSphere Client. You can also use the vSphere Client to forward logs from the ESXi hosts in your environment to an external syslog server, enabling you to centralize logs and store them long term. For each ESXi host, log in to the client, select that host, and click “Configure.” From there, select “Advanced System Settings” and edit the syslog.global.LogHost setting so that it points to the address of the syslog server you’ve set up.
Like ESXi hosts, the vCenter Server emits logs for troubleshooting and auditing purposes. Logs emitted by the vCenter Server include information about the health and status of the connection between the vCenter Server and the ESXi hosts it manages as well as cluster activity. If your vCenter Server is running on an instance of the vCenter Server Appliance (vCSA), you can use the vCenter Server Management Interface (VAMI), a web-based UI for vCSA management to forward vCenter Server logs to an external syslog server.
First, log in to the VAMI and select “Syslog” on the left sidebar. Then, specify the address of a syslog server you’ve set up and tell vSphere which port and protocol to use (e.g., TLS, TCP, UDP, etc.) to connect to that server. Once you’ve configured the vCSA and clicked “Save,” your vCenter Server will begin to forward logs to your syslog server.
Monitor your whole virtual environment with Datadog
In this post we’ve looked at how you can use vSphere’s native monitoring tools to collect metrics and log data to monitor the health and performance of your vSphere virtual environment. This included using the vSphere Client to view metrics performance charts and log files, and viewing real-time metrics data through the esxtop command line tool.
In Part 3 of this series, we’ll look at how you can use Datadog’s vSphere integration to get full visibility into your entire virtual environment, so you can monitor the key metrics covered in Part 1, alongside logs for added context when troubleshooting and traces from the applications running on your vSphere hosts. We’ll also look at Datadog’s machine learning-enabled features, that will allow you to anticipate and mitigate issues in your vSphere environment before they even occur.
