
AWS Transit Gateway is a service that makes it easy to connect multiple Amazon Virtual Private Clouds (VPCs), AWS accounts, AWS Regions, and on-premises networks together through a central hub. For AWS customers operating at global scale with many accounts and VPCs, AWS Transit Gateway greatly simplifies AWS networking architecture by eliminating the need to manage complex peering relationships and massive route tables. It also improves security by ensuring that traffic between VPCs and Transit Gateways stays encrypted and avoids traveling over the public Internet.
Today, AWS announced support for VPC Flow Logs for Transit Gateway so that customers can easily get deep, end-to-end visibility into all the network traffic going through their Transit Gateways. Prior to these logs, network administrators had to use flow logs from multiple VPCs to gain visibility into their entire AWS network. This requirement made it difficult to troubleshoot in scenarios where Transit Gateway owners lacked access to the VPC Flow Logs—a common problem when different teams own VPCs in different AWS accounts.
VPC Flow Logs for Transit Gateway solve this problem because they enable you to capture traffic through any or all attachments of a Transit Gateway. Each flow log record captures an IP traffic flow that occurs within an aggregation interval. Flow log records contain core information, such as the related attachment ID, the source/destination IPs and ports, flow direction, and the number of packets and bytes transferred. They can also provide key information useful for troubleshooting, such as the number of packets lost and the causes of that packet loss, along with all elements included in the flow—including VPCs, subnets, ENIs, availability zones, AWS services, and source/destination AWS accounts.
To support this launch, Datadog now provides an integration that makes it easy to ingest and analyze your VPC Flow Logs for Transit Gateway for a range of use cases. The integration uses Datadog’s Lambda Forwarder to push logs to Datadog from an AWS CloudWatch log group or AWS S3 Bucket, where the logs are first published.
In this post, we’ll show you how integrating VPC Flow Logs for Transit Gateway into Datadog can help you to:
Troubleshoot network issues
Datadog Log Management helps you analyze your Transit Gateway flow logs so that you can more easily identify and troubleshoot network issues that are impacting performance.
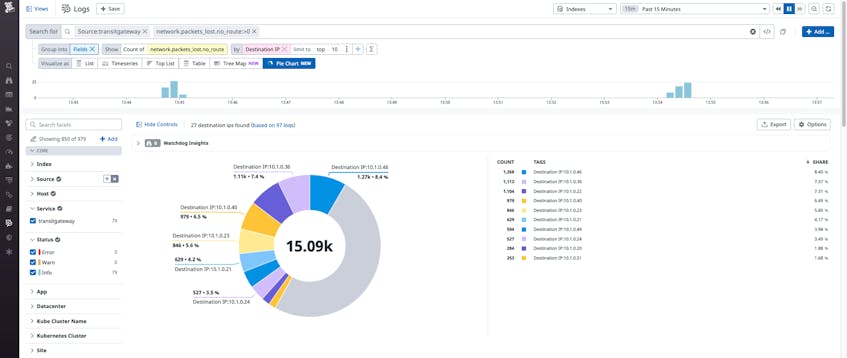
For example, packet loss can sometimes occur when you deploy applications that span multiple VPCs or cloud and on-prem networks. VPC Flow Logs for Transit Gateway provide information about the causes of this packet loss, such as:
network.packets_lost.no_route: Packets lost because of a missing routenetwork.packets_lost.black_hole: Packets being silently dropped by the destinationnetwork.packets_lost.mtu_exceeded: Packets lost from packet size exceeding the maximum transmission unit (MTU)network.packets_lost.ttl_expired: Packets lost due to time to live (TTL) expiry
By using Datadog’s Log Explorer, you can easily create a log search for one or more of these packet loss types. You can then filter or group by specific attachments, sources, or destinations, which could surface an issue with communication between (for example) AWS and your on-premises networks. Finally, you can export this query to a monitor so that you can be alerted whenever a threshold volume (defined in absolute or relative terms) of these packet loss events is reached.
Datadog can also help you use VPC Flow Logs for Transit Gateway to troubleshoot network performance issues related to traffic surges. For example, you can create a log query to determine the number of bytes of network traffic over a given period and create an alert if traffic volume exceeds an expected threshold. You can then use the Log Explorer to analyze the traffic surge by attachment, AWS account, VPC, or other attribute to quickly identify the root cause and source of the surge.
Perform network capacity planning
VPC Flow Logs for Transit Gateway are also extremely useful for performing network capacity planning. Looking at past bandwidth utilization trends, you can determine if you need to reserve more capacity to handle peak traffic volumes or re-architect your network to distribute traffic across additional VPCs, VPNs, or Direct Connect connections.
As with troubleshooting performance issues, you can also analyze traffic volume trends overall in the Datadog Log Explorer. Log Explorer lets you slice and dice traffic by attachment (such as VPC), by more granular attributes (such as AWS account, Region, or subnet), or by an AWS service (such as S3).
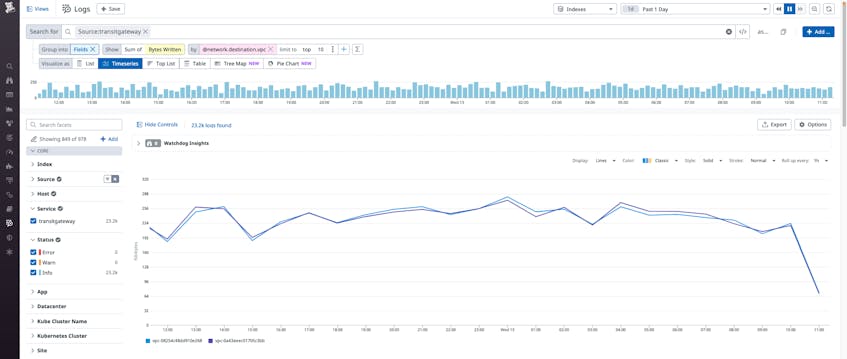
Datadog can also help you track and analyze Transit Gateway traffic volumes over longer periods of time. For example, you can generate metrics from ingested flow logs to perform a historical analysis on traffic over the past 15 months. You can also export this data to a CSV file for offline analysis.
Improve security
Flow log records can help you improve security if you use them to identify suspicious activity or communication patterns. Datadog makes this process easy when you combine the query capabilities of Datadog Log Management with the ability to create detection rules through Datadog Cloud SIEM.
For example, you can use Log Management to search for SSH connection requests over port 22 to destinations where that type of request is inappropriate. This activity could indicate that an attacker is trying to access other machines from within your AWS or on-prem network. You can also scope this log query to specific destinations of interest, if desired.
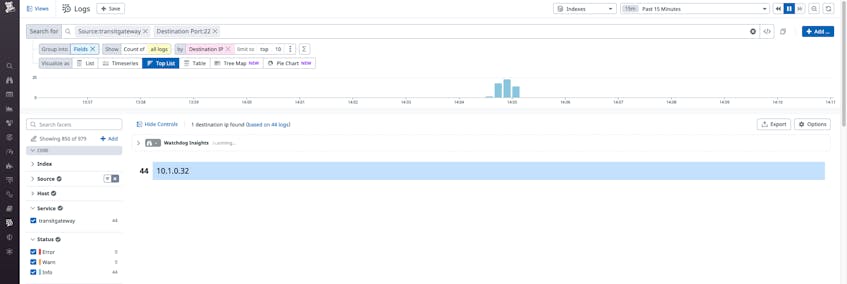
You can then export the query to create a security detection rule in Datadog Cloud SIEM so that you can be notified in real time if such suspicious activity takes place.
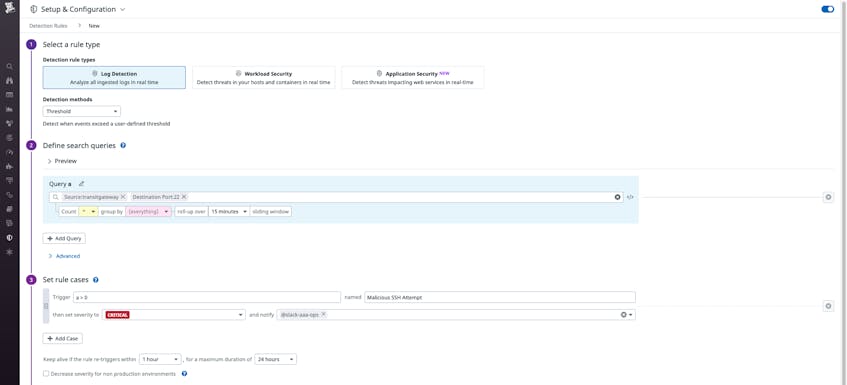
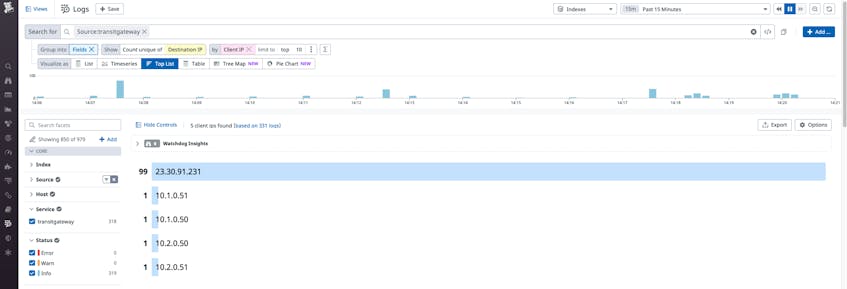
Besides looking for traffic on specific ports of interest, you may also want to set up security detection rules to spot network enumeration events, in which an attacker might be scanning your environment for a vulnerable IP address or port. You can use Datadog to identify this suspicious behavior by creating a query whose results are grouped by a single IP source and also by the count of unique destination IP addresses or ports. You can then create a security detection rule to alert you when this count of unique destination addresses or ports is unusually high.
Get started
Integrating VPC Flow Logs for AWS Transit Gateway with Datadog gives you better insight into network traffic patterns, performance, and security across your VPCs and on-premises networks. If you are a Datadog customer and want to set up this integration, check out the steps in our documentation.
What’s more, with Flex Logs—which enables cost-effective long-term analysis and on-demand querying of high-cardinality datasets—Datadog provides a storage solution excellently suited to VPC Flow logs, since they are typically high in volume and queried mainly on an ad hoc basis.
New to Datadog? Sign up for a 14-day free trial today.
