

Understanding how your users experience your application is critical—downtime, broken features, and slow page loads can lead to customer churn and lost revenue. Last year, we introduced Datadog Synthetic browser tests, which enable you to simulate key user journeys and validate that users are able to complete business-critical transactions. Many workflows involve the uploading and downloading of files, such as attaching a receipt to an expense report and downloading an order confirmation after checking out. Now, with Synthetic browser tests, you can easily verify that users are able to seamlessly upload and download files anytime, anywhere, and from any device.
Proactively monitoring your application helps you stay on track to meet your SLOs and SLAs as well as resolve any issues before they impact your users. Datadog Synthetic Monitoring is tightly integrated with the rest of the platform, so you can get an end-to-end view of your application and quickly investigate any issues that arise, without switching contexts.
Automated user experience monitoring
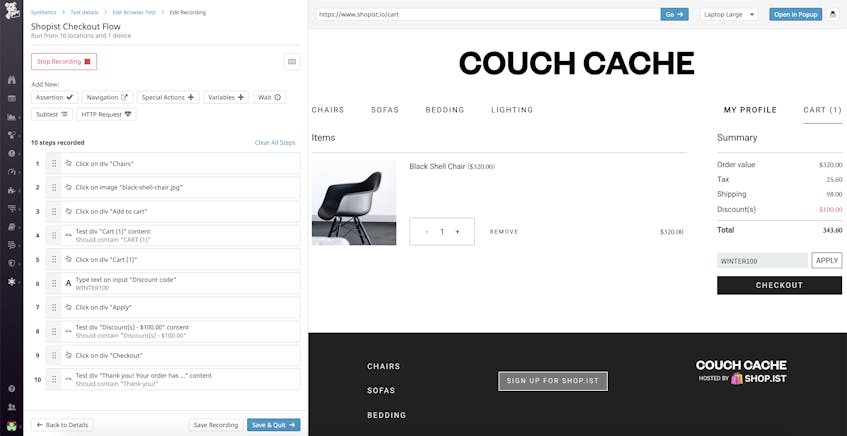
Datadog Synthetic browser tests make it easy for anyone on your team to create tests without any coding knowledge. Simply interact with your website within Datadog Synthetic Monitoring’s browser test UI, and any action you perform will be recorded as an individual step in the test. Once you’ve created your test, you’ll be able to see key performance data from test runs, broken down by geographical location and device. Each test run also displays a waterfall visualization of the time spent executing each step—along with associated screenshots—giving you a user’s view of your application.
We’ve designed our tests to be self-maintaining, which means that Datadog automatically updates your tests when it detects changes to your application’s UI. This enables teams to spend less time fixing broken tests, so they can focus on building out new features.
Test file uploads and downloads
As you incorporate more business logic into your web applications, your workflows will become increasingly complex—ranging from email confirmations to file downloads. Whether your customers need to upload profile pictures or download tax documents, browser tests can help you proactively monitor every critical step of a complex user journey. In this section, we’ll walk through how you can test file uploads and downloads with Datadog Synthetic Monitoring.
In a new or existing browser test, complete the action that would prompt the user to upload a file (e.g., click on an “Upload photo” button in your application), and select a file to upload from your device. Datadog automatically detects the action and creates an “Upload file” step. If the file upload should result in a UI change, you then can add an assertion to validate that change. In the example above, we configured the browser test to check that the “Remove photo” button appears when the user uploads a profile picture.
You can also use browser tests to ensure that downloadable files on your application—such as account statements and marketing assets—are served correctly. If, for instance, your FTP server goes down in the middle of the download, or a request to a backend service fails, users might receive an incomplete or corrupted file.
To test a file download, simply record the action that triggers the download, such as by clicking a “Download” button. Then, add a “Test a downloaded file” assertion and specify the expected name, size, and md5 string for the downloaded file. Each time the test is executed, Datadog checks that the file was correctly downloaded and uses these details to verify that the file was not modified during the download process.
Get a complete picture, from the frontend to the backend
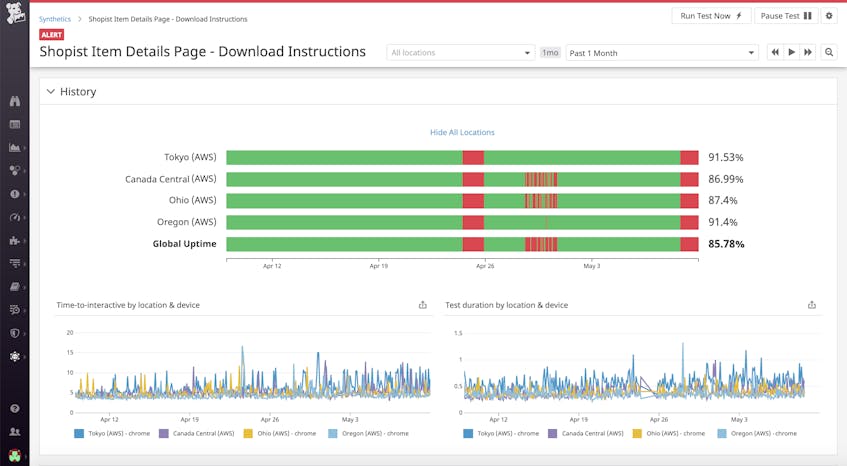
Once your browser test is up and running, you can start tracking aggregated statistics on uptime, time-to-interactive, and test duration by device and location with our out-of-the-box visualizations.
Like the rest of the Datadog platform, browser tests are integrated with collaboration tools such as Slack and PagerDuty. So when an alert triggers, you’ll not only be able to see which applications or locations are experiencing issues, but also immediately loop in the right teams to start investigating. Within an individual test result, you will see a waterfall visualization of the time spent in each step, along with any page resources, traces, or errors generated. In the example below, you can see that the test failed because it was not able to download the file.
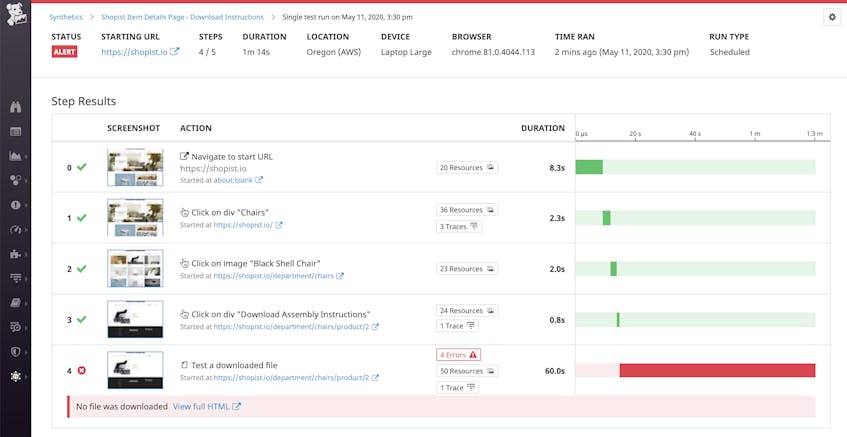
To troubleshoot, you could start by clicking on the screenshot of the failed step to see what your users are seeing—and identify potential client-side issues (e.g., missing UI components). Browser tests collect resources as well as errors—both network and JavaScript—at every step, so you can easily determine, for instance, if the request associated with the file download threw a 4xx or 5xx error.
By configuring Datadog APM to collect traces generated by your Synthetic tests, you will be able to view the full call stack of requests to determine if the errors you’re seeing are associated with your backend application code or a third-party service. Or, if a particular test step is taking especially long to complete, request traces can help you pinpoint exactly which endpoint is experiencing elevated levels of latency. From the trace view, you can seamlessly pivot to related infrastructure metrics and logs to get even more context around the issue—and fix it before it degrades your user experience.
Start monitoring user actions on your web application
Running browser tests on a schedule from an array of devices and geographical locations (including locations in your private network)—or directly from your CI pipelines—helps you ensure that your application is always fully functional and that you do not deploy buggy code that would be detrimental to your user experience. Datadog Synthetic Monitoring is fully integrated with the rest of the platform, providing rich context for troubleshooting application issues, regardless of whether they stem from the frontend or the backend. To learn more about how you can start testing your file uploads and downloads, visit our documentation. And if you aren’t yet using Datadog, you can sign up for a 14-day free trial today.
