Nicholas Thomson

John Kendall
Many organizations use Kubernetes to orchestrate their containerized applications. But because Kubernetes is complex, application developers may take some time to ramp up on the intricacies of monitoring a Kubernetes environment. This means that teams often need to create internal documentation and offer hands-on training to bridge the knowledge gap.
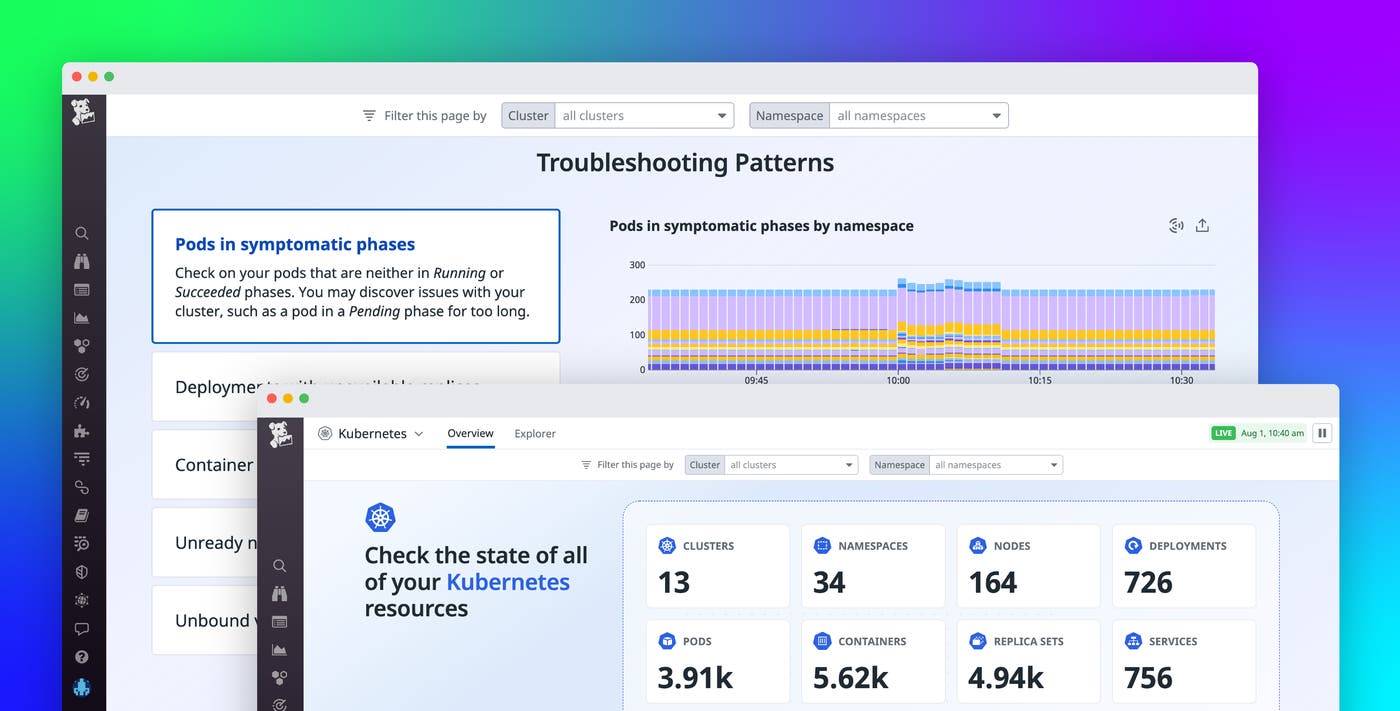
In a single pane of glass, the Datadog Kubernetes Overview Page equips any user with the knowledge to monitor and troubleshoot their Kubernetes environment. The Overview Page offers useful guidance at every stage, helping newer users learn about the infrastructure hosting their team’s applications.
In this post, we’ll show you how the Kubernetes Overview Page can help you:
- Get an overview of your Kubernetes resources
- Learn about useful troubleshooting patterns
- Quickly navigate to relevant dashboards
- View and enable Recommended Monitors
- Dive deeper into documentation, courses, and blog posts
Get an overview of your Kubernetes resources
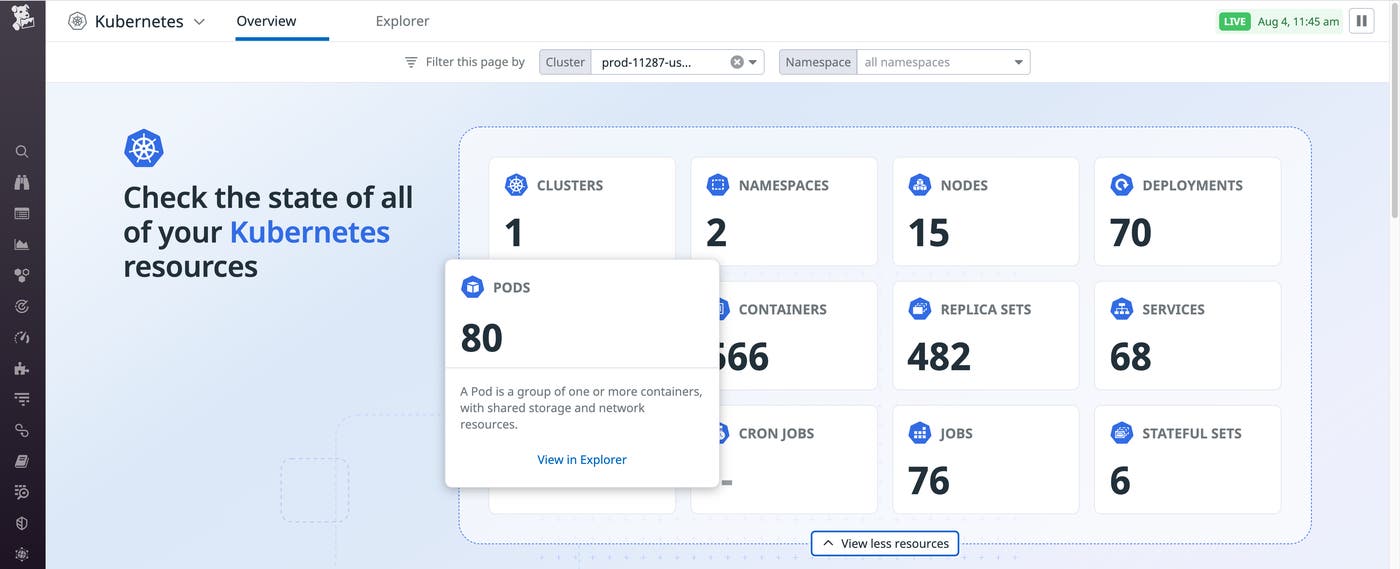
The top of the Overview Page displays a bird’s-eye view of the Kubernetes resources from all of your cluster s, including ReplicaSet s, deployment s, and service s. You can filter the page by cluster or namespace to scope your view to the data of relevance to you, and then click on any type of resource to explore its status in further detail. Hovering over each tile in the introduction section will reveal an explanation of what the resource is and a clickable link to query those resources in the Live Container view.
While the Overview Page can be a jumping off point for introducing new team members to your Kubernetes environment, you can also use this page to explore potential issues. For example, say a database hosted on one of your clusters is failing, so you filter the page to only show data from prod-11287-us-west.
To investigate further, you can click through to explore the pod s in the Live Container view. Below, you can see that all of the pods in this cluster are in a CrashLoopBackOff phase.
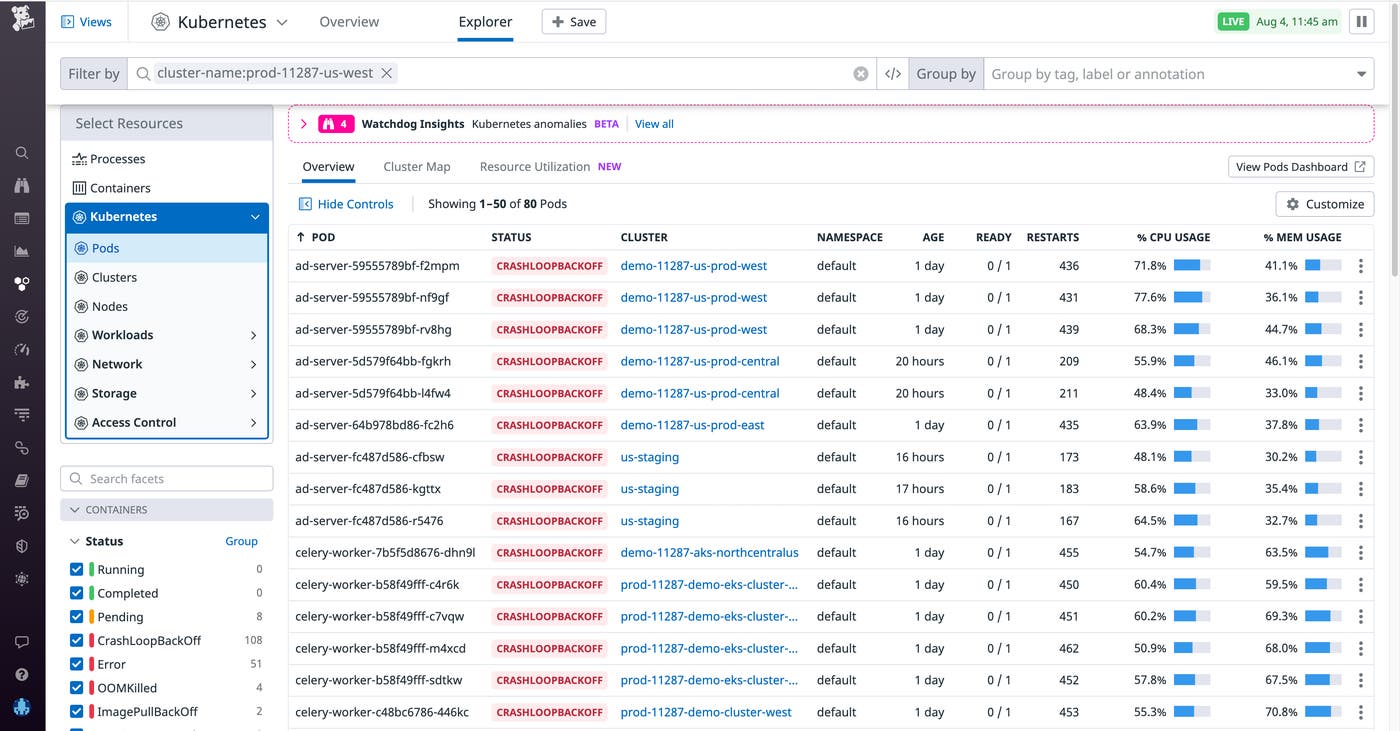
CrashLoopBackOff indicates that one or more containers in a pod are failing and restarting repeatedly. Because users may need guidance on resolving this and other common problems, the Kubernetes Overview Page also provides tips for troubleshooting issues that may affect your cluster.
Learn about useful troubleshooting patterns
Based on Datadog’s best practices, the Troubleshooting Patterns section offers guidance into five common issues in Kubernetes clusters:
- Pods in symptomatic phases
- Deployments with unavailable replicas
- Container restarts
- Unready node s
- Unbound volumes
Selecting a pattern will open a corresponding data visualization from your clusters and provide guidance on troubleshooting the issue.
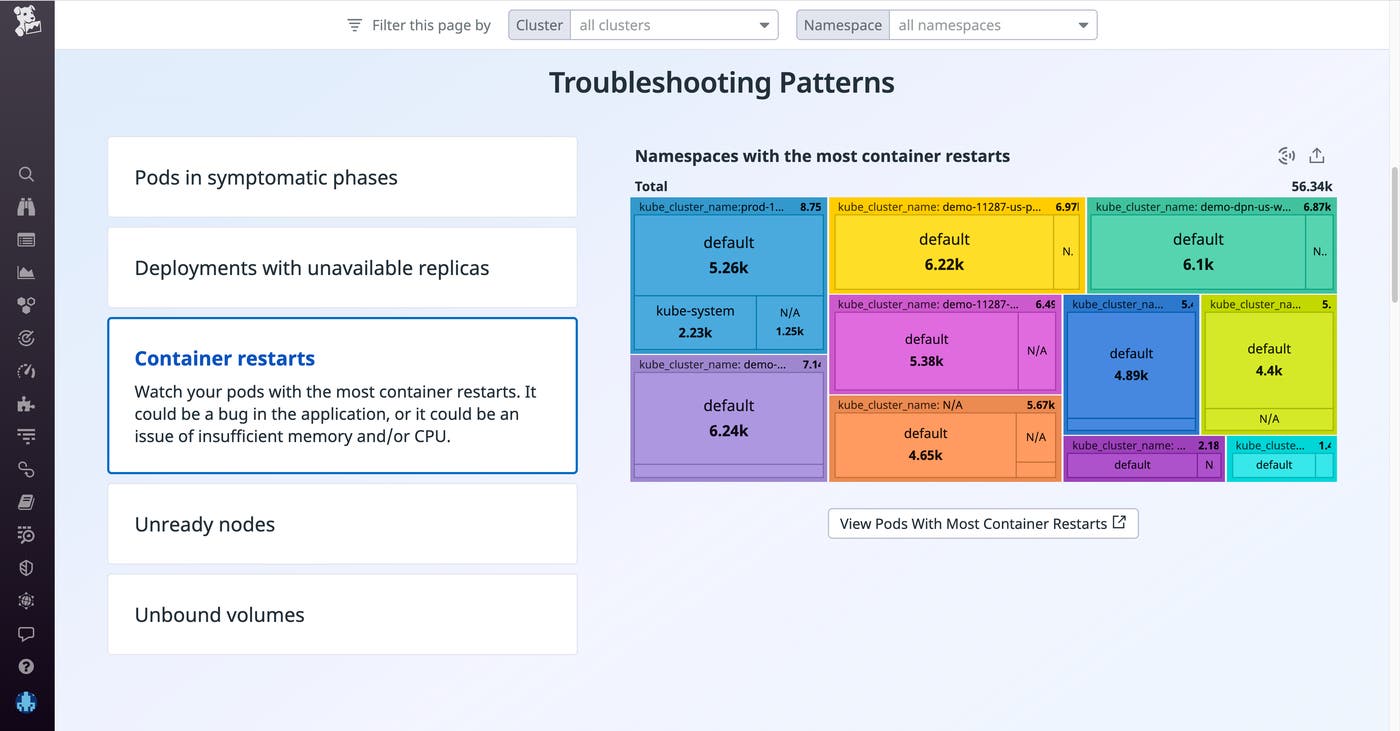
As shown above, the Overview Page suggests that container restarts could be caused by a bug in your application, or insufficient memory and/or CPU. To investigate further, you can click to view more details about the pods with the most container restarts in the Live Container view. You can also explore other data from your environment by navigating to the Recommended Dashboards section.
Quickly navigate to relevant dashboards
Datadog offers many out-of-the-box dashboards that enable you to quickly monitor specific sectors of your Kubernetes environment. The Recommended Dashboards section of the Kubernetes Overview Page makes it easy to find, clone, and customize these dashboards, which can be useful for onboarding new team members and reducing load on experienced platform engineers. This wealth of information means that anyone—regardless of team or level of familiarity with Kubernetes—can gain valuable insights for understanding their containerized applications.
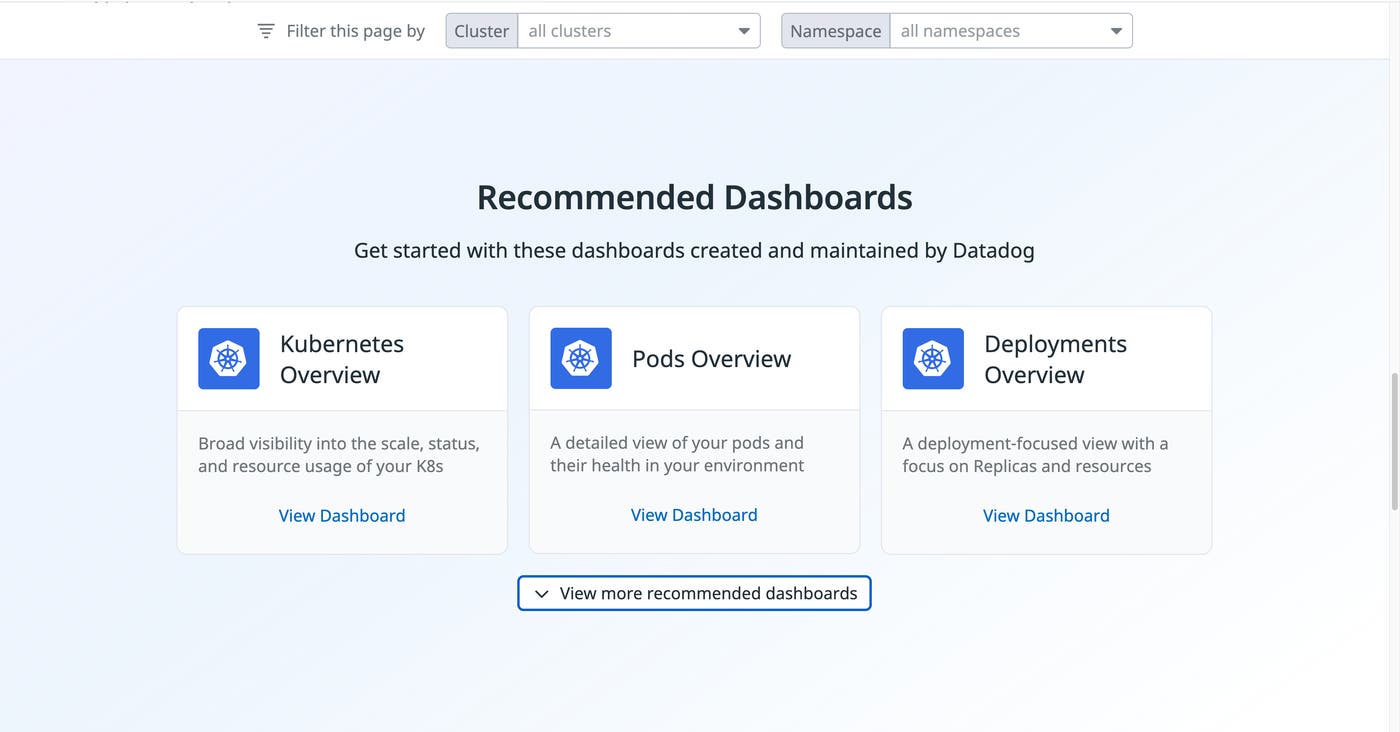
You can also use these dashboards to troubleshoot issues that you may have identified on the Overview Page. For example, if you see a high number of container restarts in the Troubleshooting Patterns section, you can explore further by navigating to the Pods Overview dashboard. The dashboard shows a recent spike in the number of terminated containers, container restarts, and containers in CrashLoopBackOff.
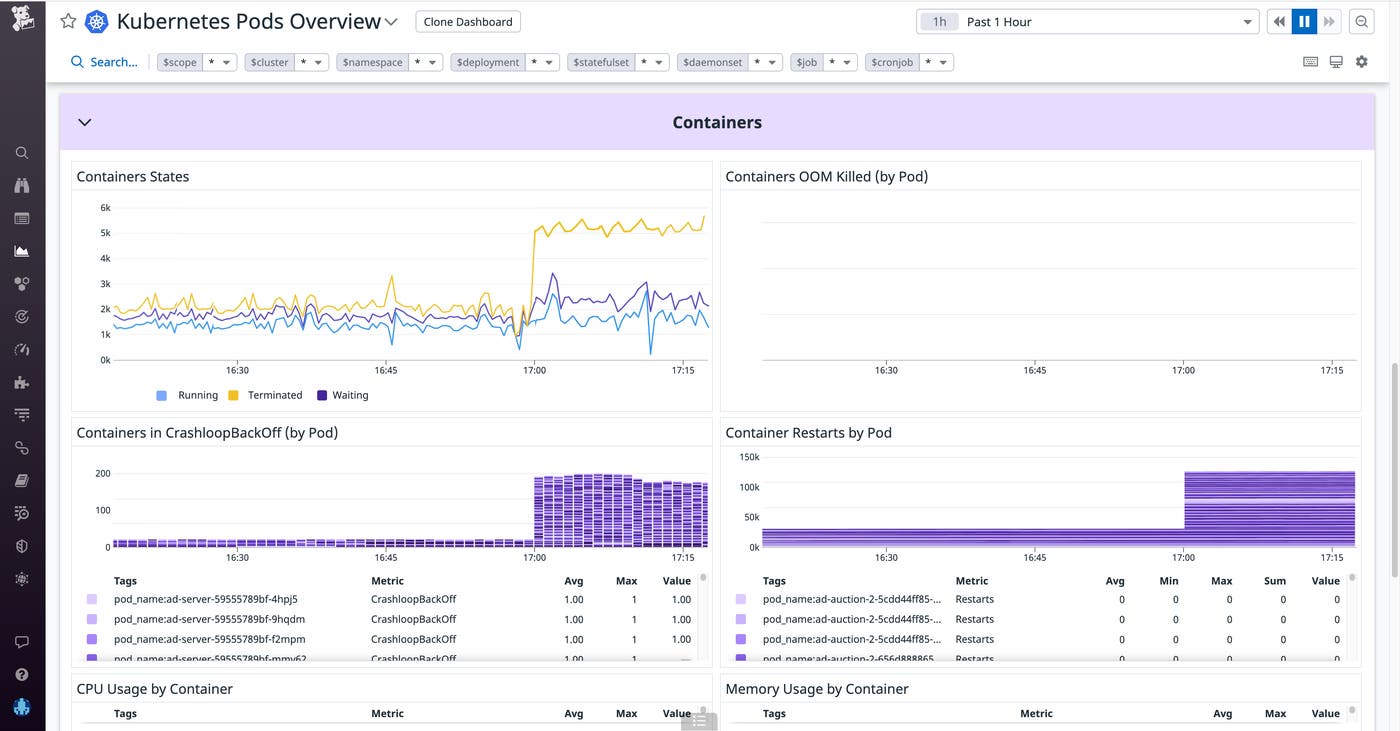
Per the guidance in the Troubleshooting Patterns section, because these containers are not specific to a single application, the problem is likely caused by insufficient memory and/or CPU. You can navigate to the Pods section of the dashboard to dig deeper.
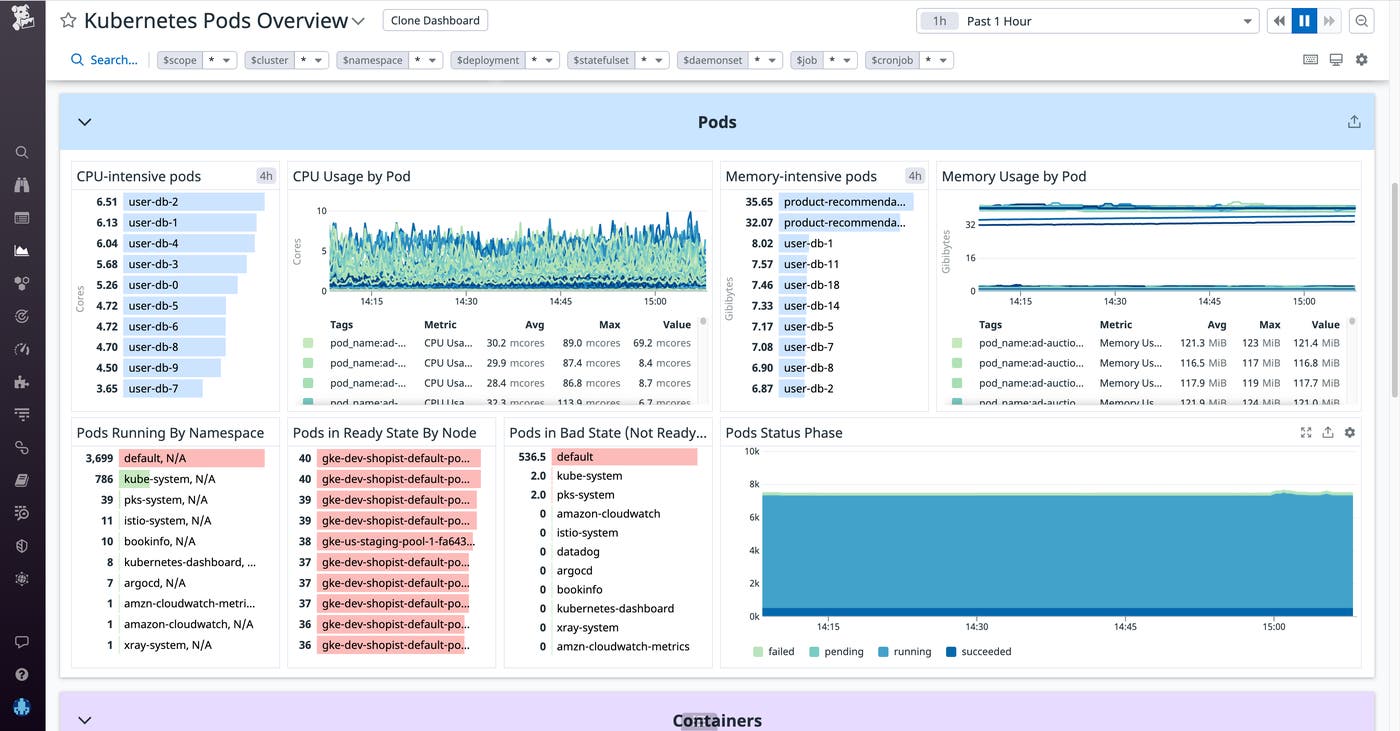
In the Memory Usage by Pod graph, you see that some pods are using more memory than normal. With this knowledge in hand, you can begin troubleshooting the problematic pods.
View and enable Recommended Monitors
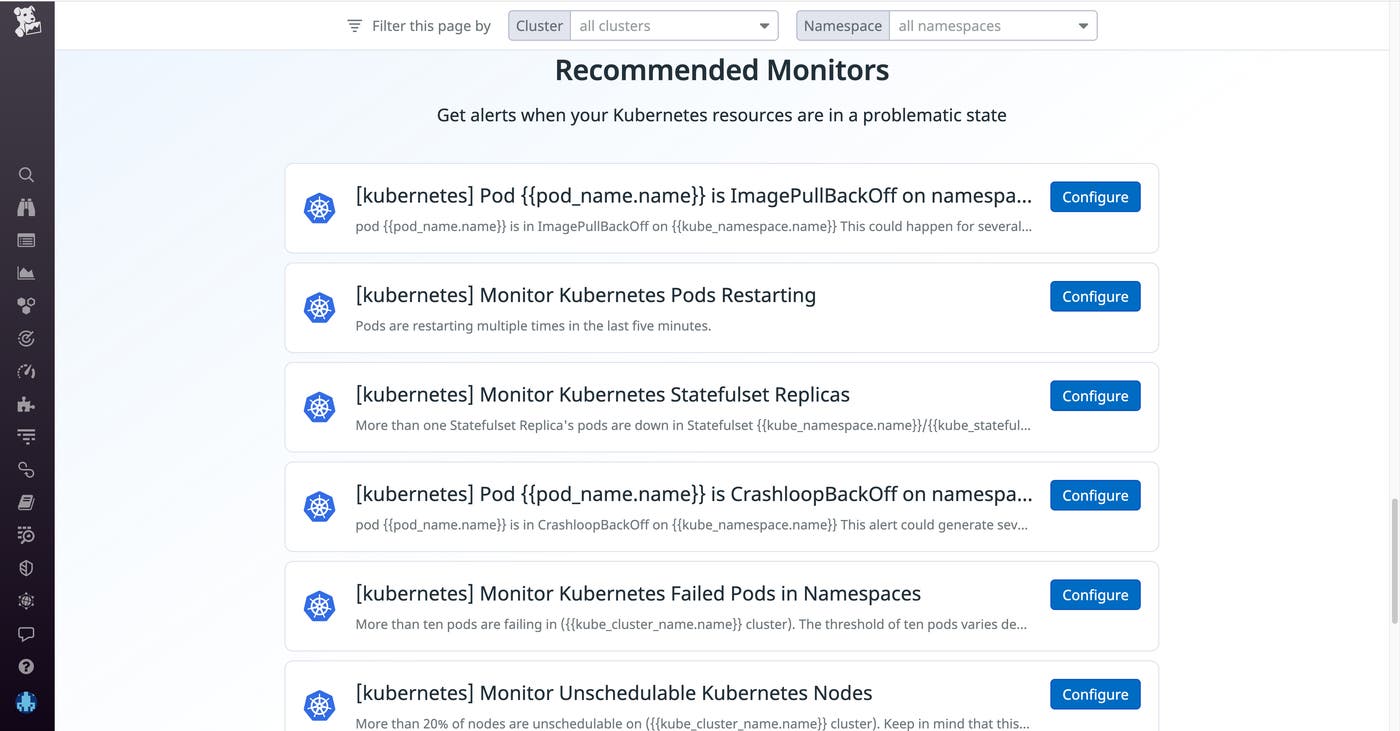
The Kubernetes Overview Page also shows you how to automatically get alerted to critical issues by enabling Recommended Monitors. You can set up these preconfigured monitors to notify you of critical changes occurring in your infrastructure, such as unschedulable nodes or pods restarting multiple times in the last five minutes.
Dive deeper into documentation, courses, and blog posts
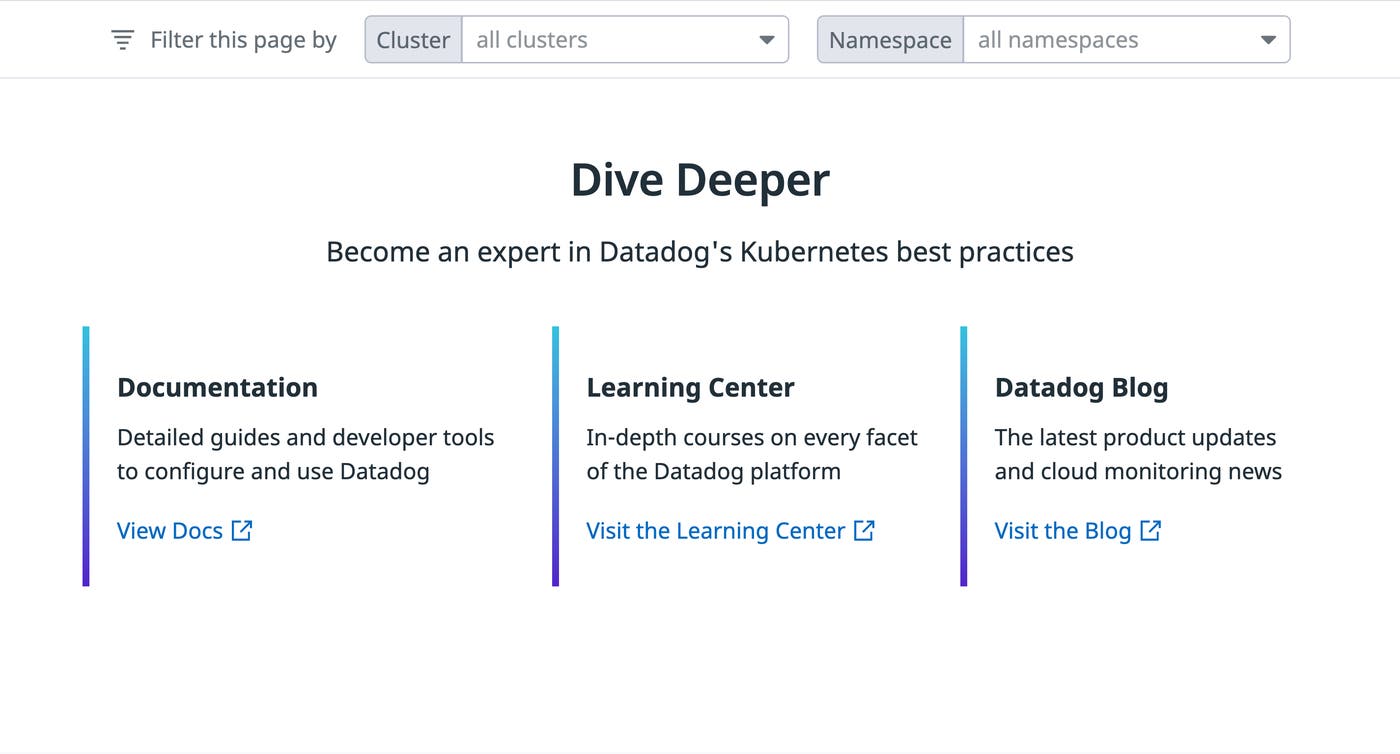
The Dive Deeper section provides links to resources that can help you learn more about best practices for monitoring and managing Kubernetes with Datadog. As shown below, you can find links to Datadog’s best practices guides, documentation, courses, and blog posts. These resources can help everyone in your organization learn how to prepare for the challenges they may face when monitoring a dynamic Kubernetes environment.
Home in on the Kubernetes Overview Page
The Kubernetes Overview Page enables everyone on your team—from new application developers to seasoned platform engineers—to get a cohesive overview of your Kubernetes clusters. It also offers guidance for troubleshooting common issues and leveraging relevant dashboards and alerts to ensure that everyone can effectively monitor their containerized applications, even if they’re new to Kubernetes.
If you aren’t already using Datadog to monitor your Kubernetes environment, sign up for a 14-day free trial to get started.
