Bowen Chen

Amina Bouabdallah
Datadog Real User Monitoring (RUM) provides end-to-end visibility into the user experience and performance of your browser and mobile applications. RUM allows you to capture and retain complete user sessions for 30 days. This means you can pinpoint bugs, prioritize issues, and determine fixes with data collected across an entire quarter.
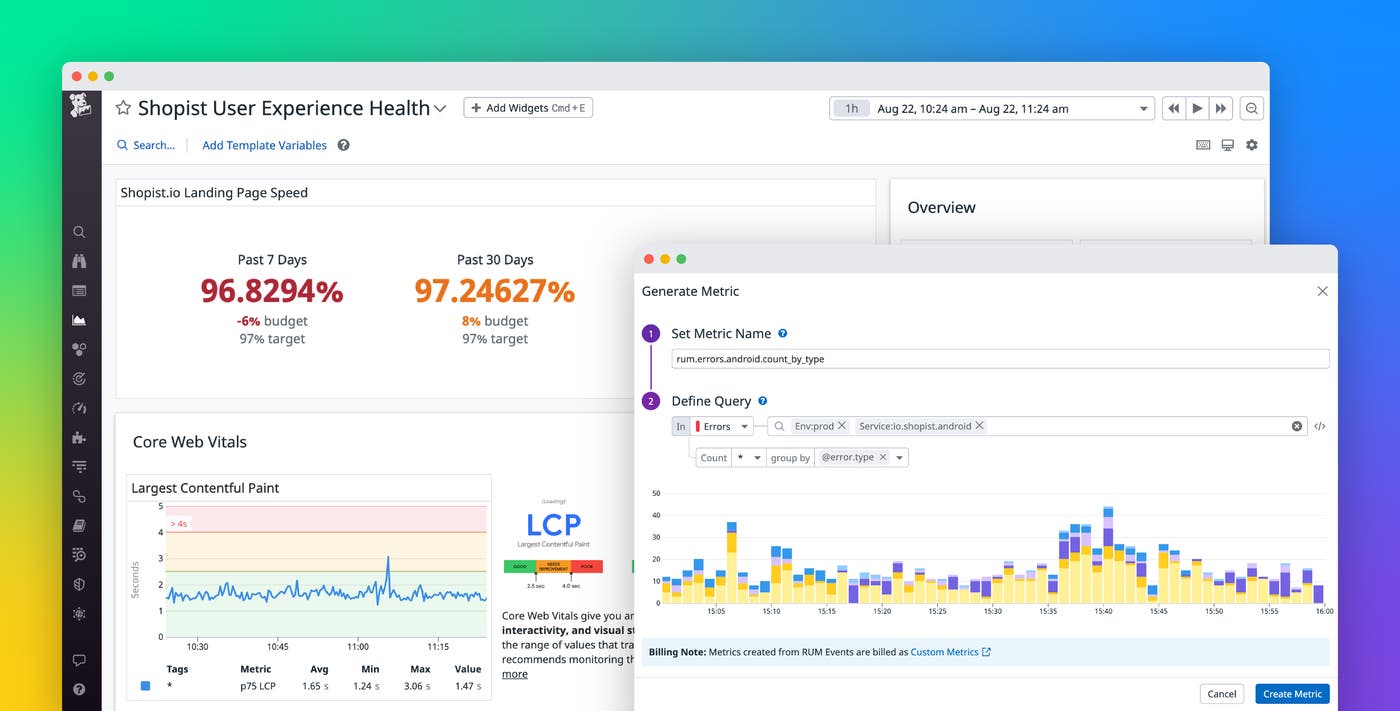
We’re excited to announce that you can now go further with your data by generating metrics from all of your RUM events. With RUM-based metrics, you can visualize 15-month trends in user activity and application health for both web and mobile applications to help determine their health throughout the year. In this post, we’ll explore how you can use RUM-based metrics to analyze historical trends in RUM events, work toward healthier customer experience with service level objectives (SLOs), and be alerted to anomalous user and application behavior.
Analyze historical trends in user events
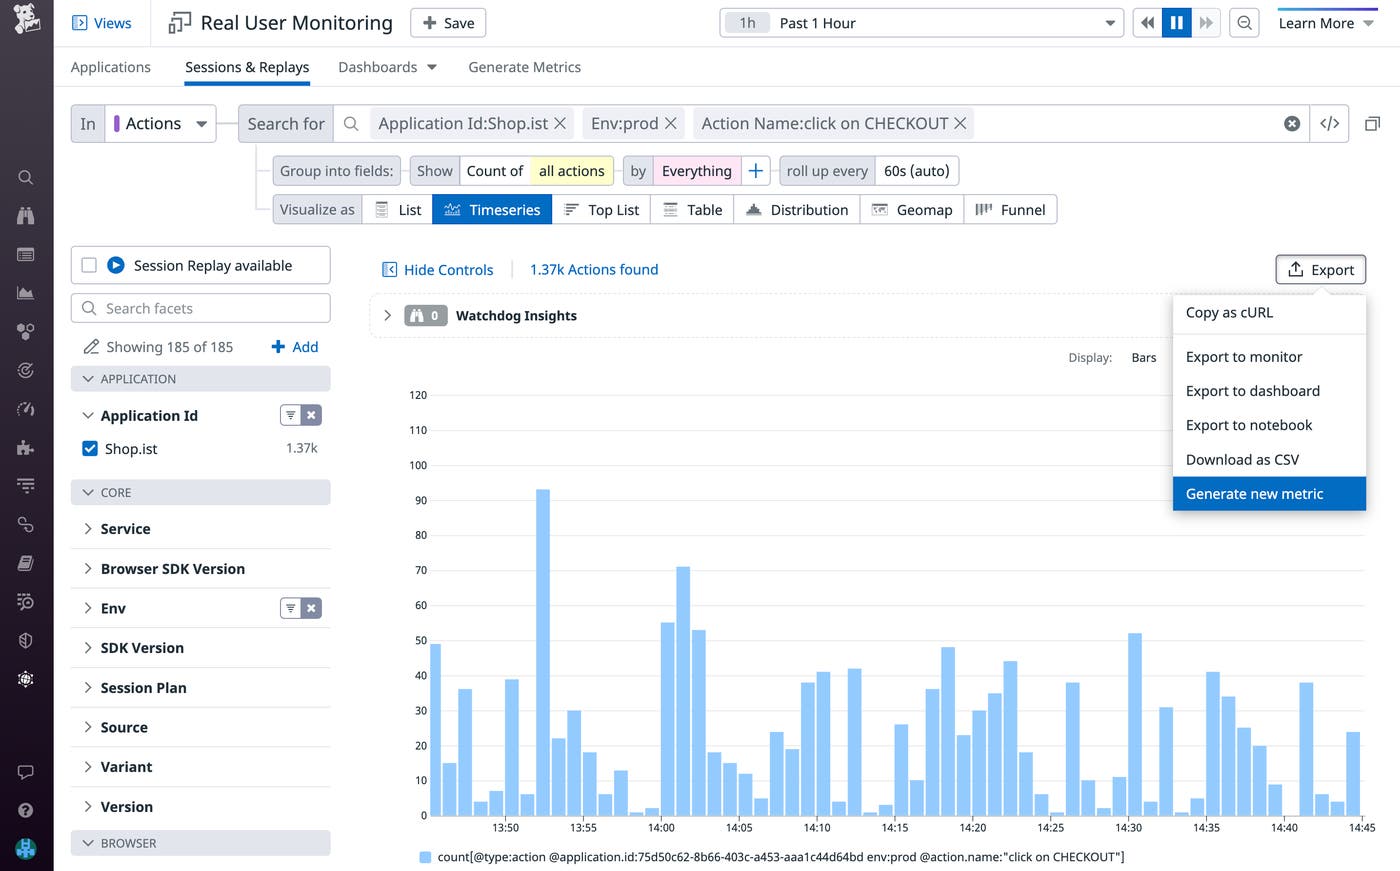
If you’ve used Datadog RUM before, you’ll be familiar with the “Sessions & Replays” tab. “Sessions & Replays” lets you query and visualize all events happening in your applications, as well as watch user browsing sessions. You can now generate metrics directly from a query by viewing it as a timeseries and exporting it. This will open the metric in our new “Generate Metrics” tab, where you can create and view all of your custom RUM-based metrics.
RUM events collected by Datadog are automatically tagged with their event type, enabling you to quickly filter by session, action, or error. Generating error count and latency metrics from sessions and view events can help monitor application health, while generating metrics from custom action events can highlight trends in user engagement. For example, if you’d like to track the volume of user clicks on the “Purchase” button of your web store’s checkout page, you can generate a metric using the RUM action query shown below. You can then leverage these checkout metrics using Datadog’s dashboards, monitors, and other features for broader insights into your application’s conversion rate.
Metrics created from RUM events are retained for 15 months, enabling you to use historical data to analyze seasonal traffic patterns and year-to-year growth. For example, if your business conducts a large volume of digital sales each January, you can use RUM-based metrics to compare:
- This January’s sales against the previous January’s sales
- This January’s sales against the normal sales season
- Your landing page’s loading times year-to-year during peak sales traffic
Track SLOs to maintain a high-quality user experience
When monitoring the health of your application, it’s tempting to only focus on key performance indicators such as latency, error rate, and other server-side telemetry. However, relying solely on monitoring backend systems isn’t enough to fully understand your end user experience. Backend metrics only tell part of the story—for a more complete view of how users are experiencing your application, you must also incorporate RUM and client-side data. You can use RUM-based metrics as service level indicators (SLIs)—the measurements—to establish SLOs—the internal target values. For example, creating an SLI that measures loading time is essential if you want to track your landing page’s latency and work toward maximizing customer retention. This SLI can then be used to create an SLO (shown below) that measures the percent of page loads over a set healthy target.
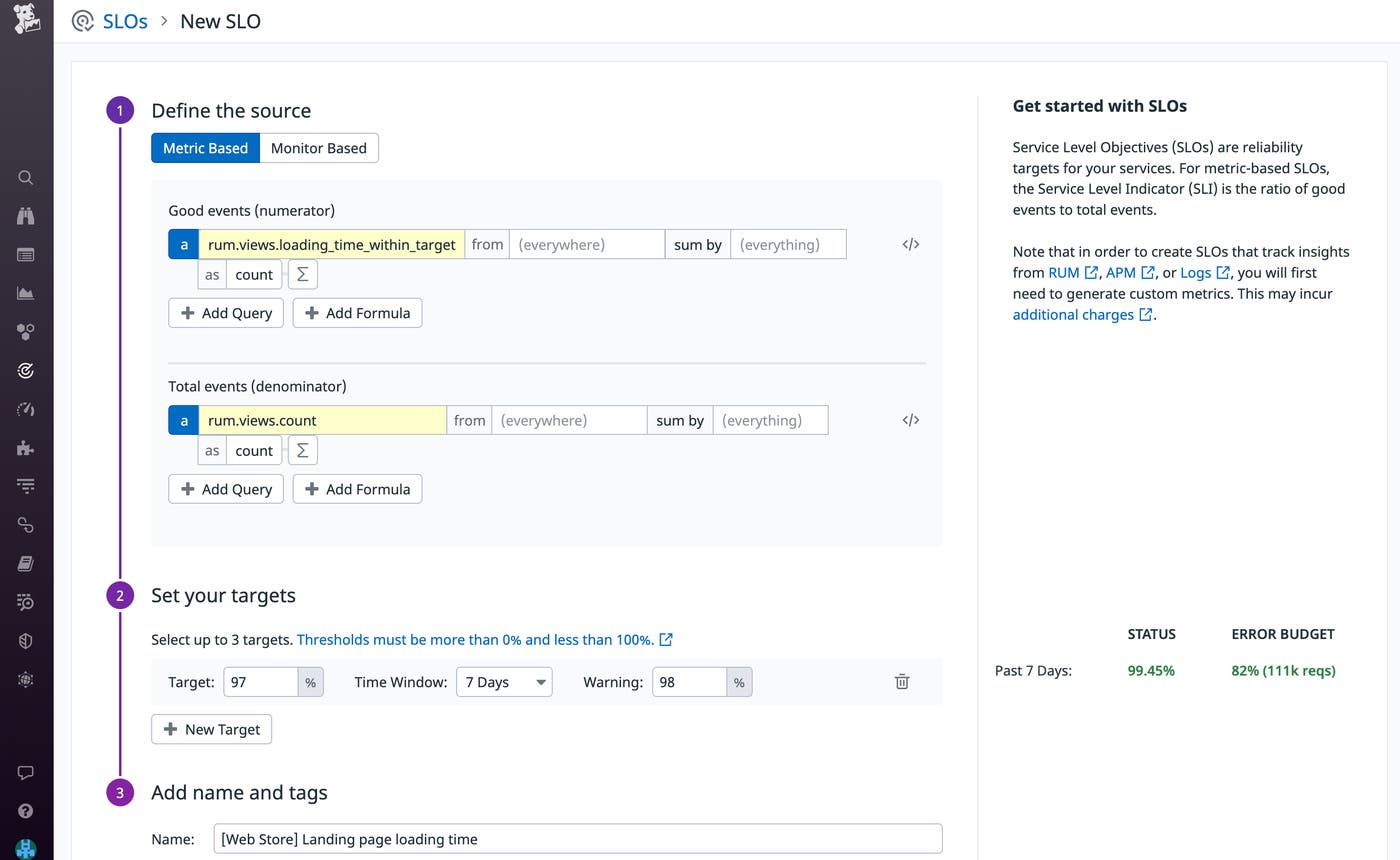
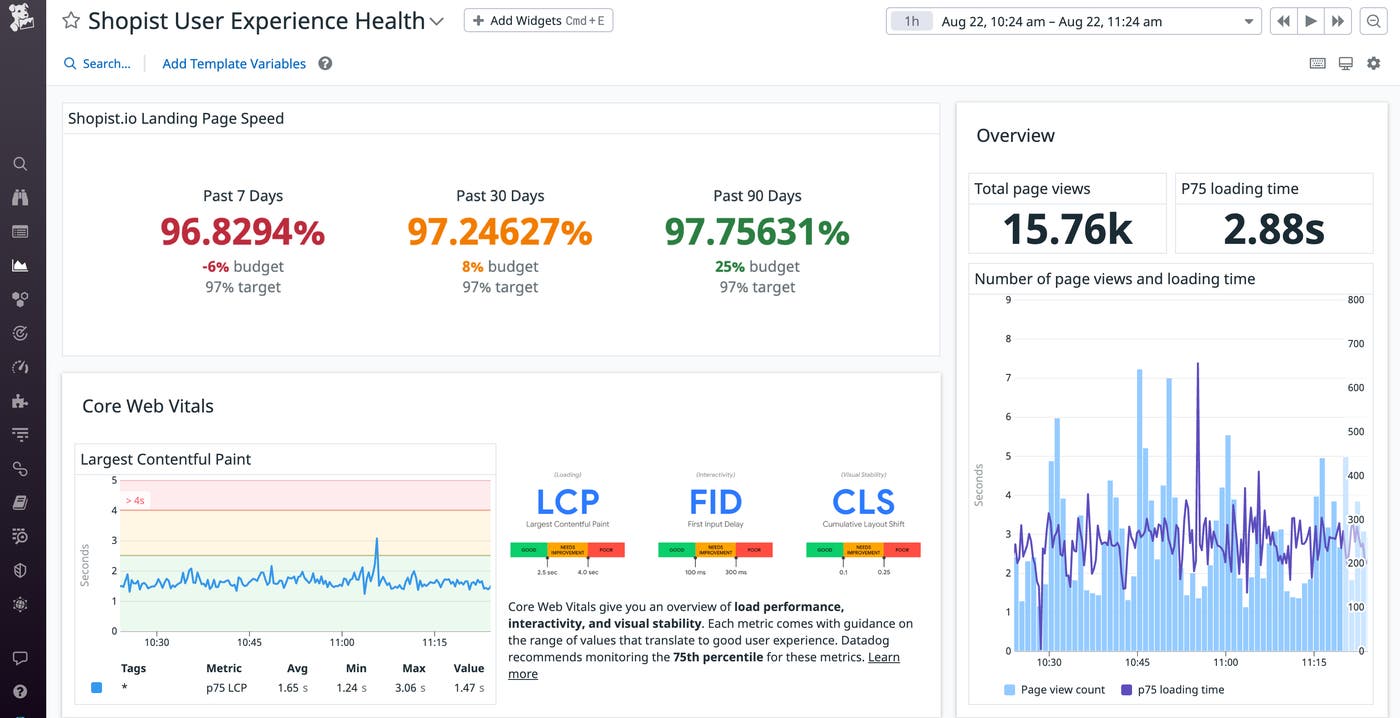
User-centric SLOs allow frontend development teams to maintain accountability using quantitative benchmarks that measure user experience. By adding SLO widgets to your dashboards, you can visualize your user experience objectives alongside other essential application metrics. The color-coded SLO status indicates when you need to rally your team to take action when your web page’s loading speed falls below your target objective. To learn more about best practices for setting SLOs, check out our blog post.
Configure alerts for anomalous behavior
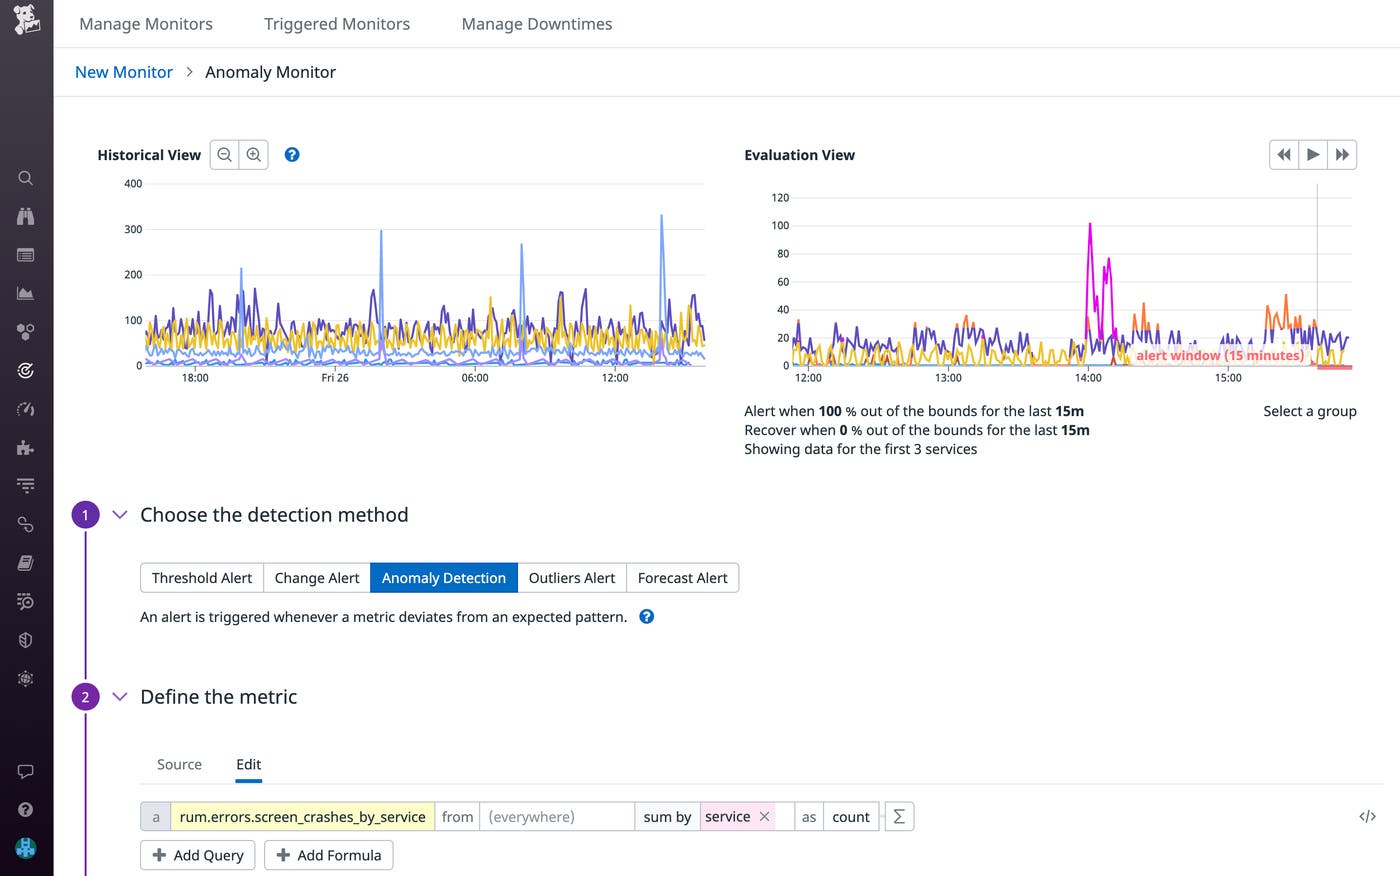
Important metrics, such as your site’s purchase volume and the loading time of your web apps on various devices and networks, tend to have pronounced peaks and valleys depending on the day of the week or time of year. Anomaly detection lets you discover when the number of purchases is unusually low on a Friday afternoon, for example, even though that same level of traffic is normal later in the evening. Thresholds set manually can quickly become outdated due to changing traffic patterns; however, anomaly detection can alert you of unexpected drops—potentially indicating a bug in your application.
With RUM-based metrics, you can now configure anomaly monitors and forecast monitors for all of your RUM events. By configuring an anomaly monitor for screen crashes across your services (as shown below), you’ll be alerted to unusual spikes in errors, enabling you to resolve these issues before they create broader customer impact.
Gain full insight into all of your events with RUM-based metrics
RUM-based metrics create an efficient solution to managing large volumes of sessions by enabling you to analyze clear historical trends and leverage the full suite of Datadog’s metric-based features. Whether you want to visualize your RUM data using a dashboard widget, create user-centric SLOs, or be alerted of anomalous user activity, you can begin by generating a custom RUM metric. If you aren’t already a Datadog customer, sign up today for a 14-day free trial.
