Last week, I reviewed some of the most notable sessions we saw at two of the greatest WebOps/DevOps events in their Silicon Valley editions: Velocity and DevOpsDays. Below is the continuation of the curated list of talks that made the strongest impression on the Datadog team.
Is Your Team Instrument Rated (or: Deploying 125,000 times a day) (DevOpsDays)
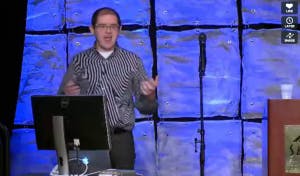
With a title like this J. Paul Reede surely got everybody’s attention.
Deploying 125,000 times a day refers to the number of daily aircraft takeoffs, most of which luckily happen without any notable incident. A pilot, J. Paul presented at a high level some key lessons from the national airspace system in the United States to inspire the DevOps community to build a robust operational framework.
As expected a lot of it revolves around clear and crisp communication coupled with shared expectations when dealing with issues. Much like John Allspaw before him, J. Paul warned us against a blind faith in automation as a way to deal with complexity. Recent aviation incidents clearly showed the limits of misinterpreting metrics or fully relying on automation to get us out of trouble magically.
Click the image below to launch the video!
Stop the Guessing: Performance Methodologies for Production Systems (Velocity)
Brendan Gregg presented the do’s and the don’ts of performance monitoring with a strong emphasis on eliminating guesswork. To do so he recommended a three-pronged approach to get the best results:
- Workload characterization
- USE
- Thread-state analysis
Workload characterization is just another way to say: look at the work your systems are doing (notice the reference to work as opposed to just activity) and make sure every bit is required. He lauded the approach as the one yielding the best results with the least amount of effort.
USE is a method Brendan has devised to not drown into details. USE stands for Utilization, Saturation, Errors. It is a useful lens to characterize and quantify how the basic resources of a system (cpu, network, memory, storage) are consumed. It is practical in that only 3 metrics per resource are required, as opposed to the 100s that are available. The main caveat is that USE only cares about resource bottlenecks (e.g. maxed-out CPU), which in turn help with getting the systems to do more work. So it is not as direct as workload characterization.
Finally thread-state analysis is a low-level approach very similar to what profiling means on a piece of code, except that it’s done at the system level. Track which threads are using the CPUs and in which state these threads are in (sleeping, blocked, etc.) and focus the longest non-idle thread state. Out of the three, it is the hardest to put in place as it requires a fine-grained instrumentation of the operating system.
Brendan’s overall and most important message: don’t jump to tools, first formalize the questions you want answers to from the system you’re monitoring. Only when you’ve done that, focus on getting the answers.
Slides for this presentation are available on the O’Reilly website.
Building a billion-user load balancer (Velocity)
Adam Lazur from the Traffic Team at Facebook gave a well-attended talk about the new load balancing architecture that Facebook had to come up with to deal with a billion users spread out over the entire planet. Adam gave us a glimpse into Facebook’s massive traffic handling.
A billion users means for Facebook over 12 million HTTP requests per second. To handle the load, traffic is first handled by a few TCP proxies, which then forward HTTP traffic to a larger group of HTTP proxies, which themselves sit in front of a even larger number of servers.
The geographical distribution of their users is such that the first act of load balancing is handled by DNS. Having an out-of-date DNS configuration means sending a lot of users’ HTTP queries to data centers that are not optimally close to them. And that translates pretty directly into slower requests (and less user engagement).
Most of the presentation was spent of Cartographer, a dynamic configuration engine for DNS. The job of Cartographer is to continuously provision Facebook’s DNS servers with a configuration that is updated based on various network conditions.
Aside from the technology, Adam’s talk was particularly candid about the initial results, their rollout strategy and the times they had to to fix things as they rolled out new versions (fairly quickly at that).
There were however no slides or video from this presentation, but a detailed abstract is available on the O’Reilly website.
See you soon at Velocity and DevOpsDays
We’re looking forward to the upcoming Velocity later this year in New York (where some of us from Datadog will be presenting as well) and will continue to sponsor DevOpsDays around the world.


