Thomas Sobolik
Static sites are currently a popular solution for many lightweight web applications, such as corpsites, blogs, job listings, and documentation repositories. In static web architecture, pages are generated and pre-rendered at build time from markup files, and usually cached in a content delivery network (CDN) for efficient delivery. This saves teams the effort and cost of server management while enabling fast page load times.
With the majority of (if not all) backend logic migrated to the build process and CI/CD, reliance on CDNs for delivering both static assets and page markup, and limited options for instrumenting the frontend to track UX performance, monitoring the health and performance of static web apps presents some challenges. In this post, we’ll discuss some of the core features of static web architecture and outline best practices for effective monitoring, including the key metrics and other data that you should collect to:
- Optimize caching and delivery from the CDN by collecting real user session data as well as performance and security data from the CDN provider
- Monitor the build-to-deploy cycle, including the supplemental build infrastructure, CI pipelines, and synthetic tests
An overview of static web architecture
Static sites are typically written using a combination of static markup files (HTML, JavaScript, and CSS) that are compiled and pre-rendered during the build process and served at request time from a CDN. By pre-rendering pages and caching them in the CDN, static web architecture circumvents most client- or server-side rendering. This results in stable, fast-loading pages, and reduces the need for lazy loading, progressive rendering, and other optimization strategies that can affect the user experience.
Components of the build-to-deploy cycle
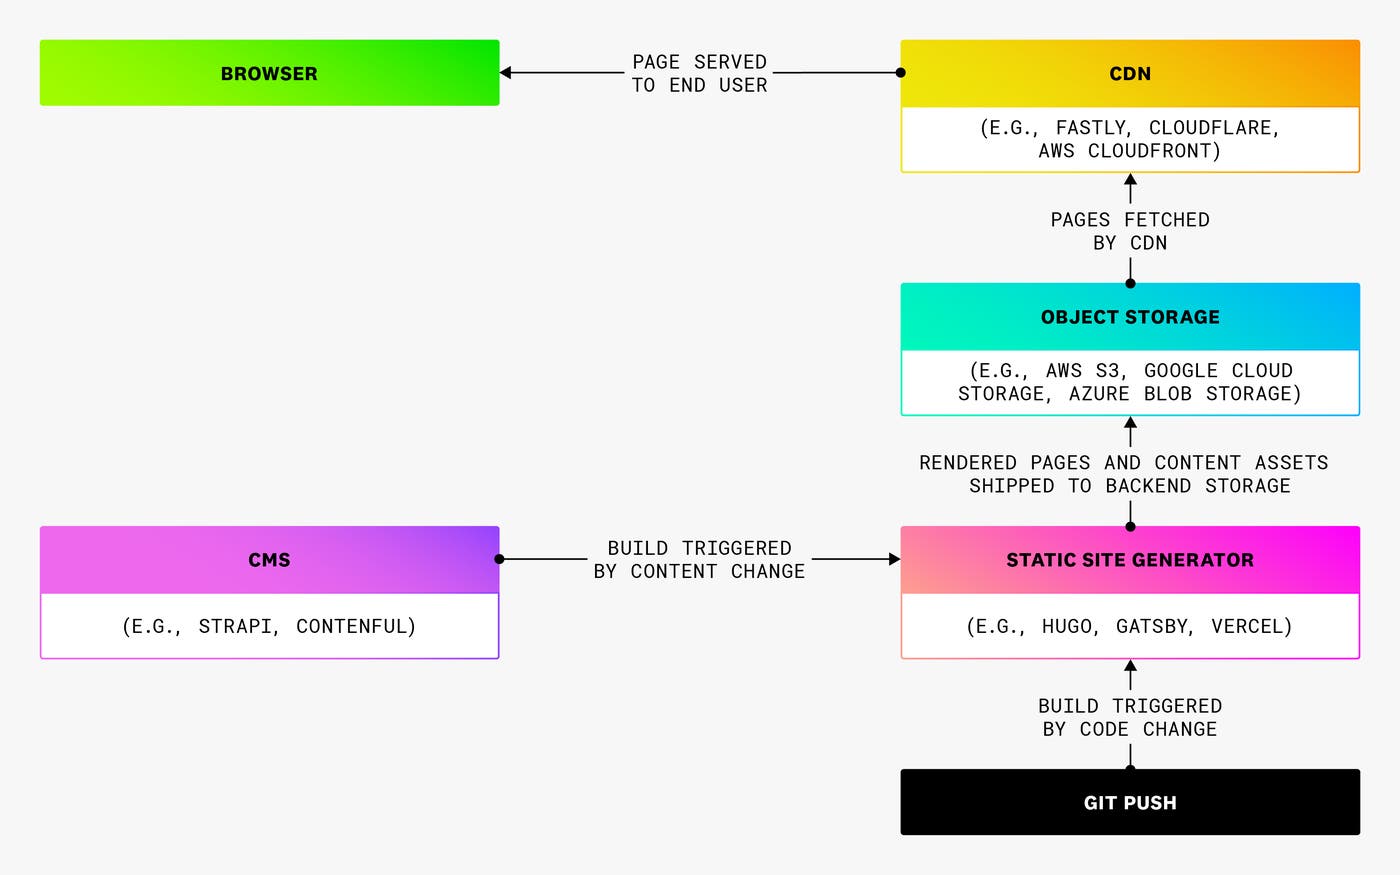
The earliest static webpages were written in vanilla HTML, with the eventual addition of CSS. These days, most are written using a modern JavaScript framework (such as React.js) or compiled into HTML, CSS, and JavaScript using a static site generator (such as Gatsby or Hugo). To deploy the application, the build tool renders the content and pages, and typically pushes them to a simple object store, such as an AWS S3 bucket. To serve the pages to clients, a CDN sits at the network edge to handle requests by providing URL routing, TLS and SSL termination, and the caching of pages and other assets. To ensure smooth orchestration of the build and deployment processes, static web application deployments need to be atomic. In an atomic deployment, all of the code and assets in a new build are updated simultaneously, preventing the application from being served in a partially updated state.
Atomic deployments require that a full rebuild of the application is triggered with each new content change or code version. This means that a highly available and performant static web app needs to have an efficient and well-managed CI/CD pipeline. Static web architecture migrates the majority of rendering and other backend logic to this CI/CD pipeline, often employing a lightweight, serverless compute layer to help orchestrate communication between the build and deployment processes. In many cases, the backend will also include a content management system (CMS) that non-technical contributors can use to add or edit content without pushing code. Typically, a headless CMS will be implemented into the static site generator by using either its template engine or custom logic such as webhooks. The following diagram illustrates at a high level how all these components work together:
Monitoring data you should collect
Just like with any other web application architecture, you should monitor your static web application using a combination of telemetry collected from real users’ browser sessions with observability data from your infrastructure dependencies. This enables you to maintain visibility into the health and performance of your infrastructure while tracking the resultant impacts on the end user experience. In the case of static web architecture, infrastructure dependencies include the CDN, object storage, compute instances, deployment orchestration tools, and any additional systems (such as the CMS). It’s also particularly important to monitor your CI/CD, including your version control system, build pipelines, and tests, to maintain the efficacy of your testing and ensure that builds are happening quickly. To summarize, we’ll talk in this post about leveraging the following types of observability data to ensure that your static web applications are performing as they should:
- Frontend session data, to track page loads and their dependent CDN requests
- CDN request logs, as well as health, performance, and security data from the CDN
- Metrics and logs from your build and deployment tools, including your CI/CD pipelines
Optimize caching and delivery
Static web applications help reduce a lot of the challenges inherent in client- or server-rendered web apps by decreasing the initial page load time, promoting visual stability, and reducing the size of pages. By eliminating the rendering step when a user requests a page, static sites optimize key UX metrics like first contentful paint (FCP) and cumulative layout shift (CLS). Still, it’s important to monitor the page load performance of your app in order to manage errors and latency. And it’s equally important to monitor your CDN’s performance to ensure that it is serving content quickly, manage CDN provider outages, track security threats, and prevent stale content from being served to users. In this section, we’ll outline best practices for monitoring your CDN to ensure your app’s pages and content are being served efficiently to users.
Measure your CDN’s performance with real user data
First, you should collect frontend session data to measure your app’s end user performance and get a granular view into errors and latency during page loads. You can use real user monitoring (RUM) to get a breakdown of event timings and errors for each page load step. This enables you to investigate view loads to find which events—such as asset requests, rendering steps, or runtime JavaScript routines—are contributing to latency and errors. Because your entire application is being served from the CDN, it’s particularly important to use RUM views to track CDN requests for specific page assets. You should inspect your views to spot which assets are taking the longest to load, as well as any failed requests (for example, due to a stale request for content that’s no longer in the cache).
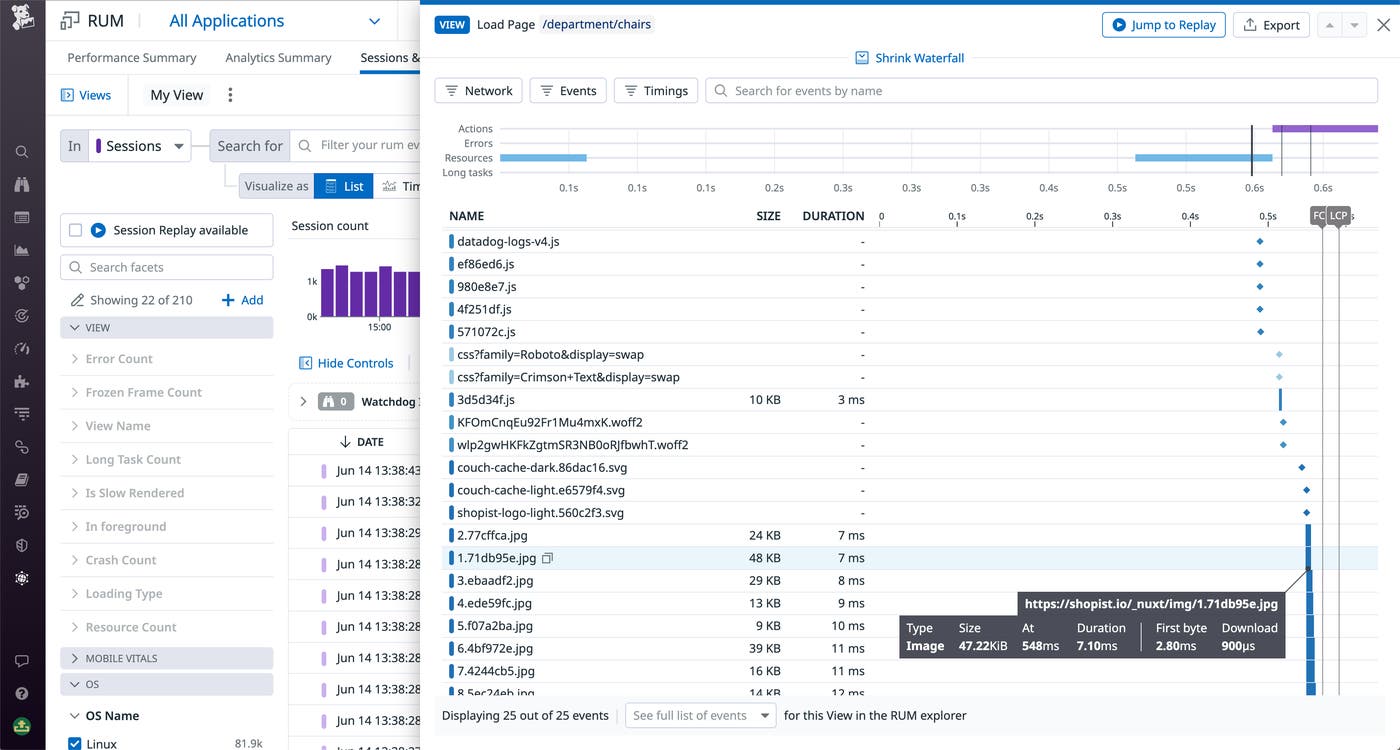
Your RUM views should also break down any JavaScript payloads that run during the page load, so that you can spot errors in this code that may be causing your pages to break. Beyond page load steps and other out-of-the-box RUM events, you can instrument your frontend code with custom performance timing to break out separate measurements for specific key UI workflows, such as signups, form submissions, or searches. By instrumenting your code to time these workflows and log errors or key user metadata, you can create monitors and visualizations to continually track their performance. This will enable you to better understand issues and limit their end user impact.
Collect health and performance metrics and logs from your CDN
While it’s a good start to collect CDN request metrics from the client side in order to understand your app’s end user performance, it’s also important to maintain visibility into the performance and availability of your CDN by collecting metrics and logs from your CDN provider. This enables you to correlate UX performance issues that you detect in RUM with cache misconfigurations, provider outages leading to regional latency, security threats, bandwidth exhaustion, and other potential problems that might originate from the CDN.
If you’ve built your application with a full-stack, static-forward PaaS, such as Vercel or Netlify, your sites will rely on their proprietary edge networks and you won’t be able to control the CDN configuration. But if you’re deploying your own stack using a managed service (such as AWS CloudFront, Fastly, Akamai, or CloudFlare), it’s important to monitor CDN logs and metrics closely so you can appropriately tune your cache policies to optimize performance.
Collect cache purge logs
In order to facilitate your app’s atomic deployments, your CDN must frequently perform instant cache purges (where all assets are simultaneously purged and replaced with the new build). By collecting logs from purge events, you can form a metric to track the latency of your cache purges, and examine whether the time it takes to purge the cache is a significant factor in your app’s time to deliver (TTD).
Monitor performance metrics to optimize cache configuration policies
To ensure that your CDN can cache and serve assets efficiently, it’s paramount to optimize your CDN cache’s time-to-live (TTL) policy, or how long each asset persists in the cache before being automatically purged. You also need to decide which files to cache in users’ browsers (specified in the cache-control header of your HTML). To inform these decisions, you can look at your CDN’s request logs, as well as key out-of-the-box metrics, including the cache hit ratio and average edge response time. Monitoring edge latency broken down by region and/or data center is also important, because this can avail you of outages from your CDN provider and help you understand which customer locations are affected.
Track bandwidth usage for visibility into CDN cost
Finally, with the CDN acting as your main server, CDN bandwidth costs are a primary concern for the cloud cost management of your static web application. Thus, it’s important to monitor your CDN’s bandwidth metrics, as these are the best indicator of what the CDN provider will be billing you for.
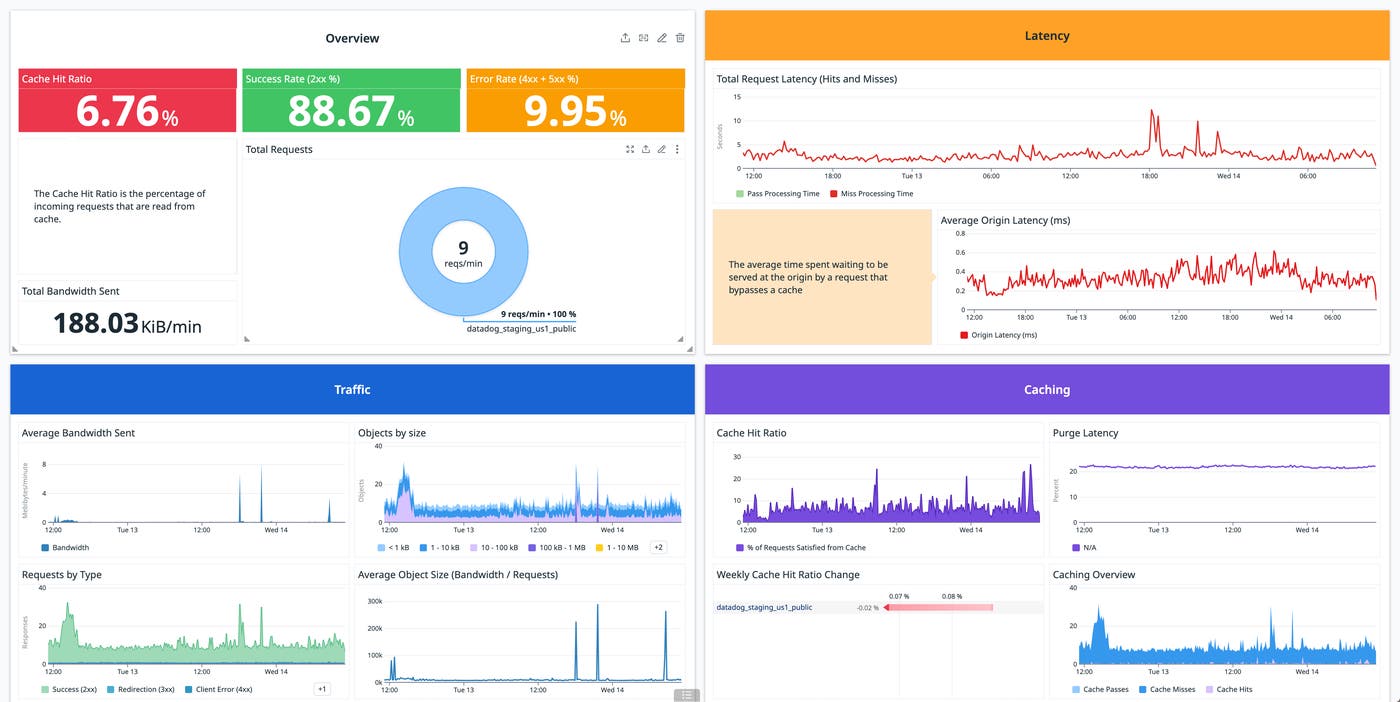
The following dashboard collates many of the aforementioned metrics and logs in a single pane. Collecting metrics and logs from your CDN provider in a custom dashboard like this can help provide a jumping-off point for investigations, as well as a highly shareable and parseable view that can be distributed among disparate stakeholders in your organization.
Collect security monitoring data from the CDN
Static web applications have a relatively low attack surface area compared to server-rendered ones, but the CDN remains a key security liability. Because CDNs mediate users’ requests to serve pages and content, they are the natural first line of defense against browser attacks. This makes it important to collect telemetry from your CDN’s security features in order to spot threats and correlate attacks with degraded performance and outages.
Many CDN providers, such as Fastly and CloudFlare, provide security features—such as DDoS mitigation, web application firewalls (WAFs), and bot traffic protection—that identify threats, block malicious IPs, and automatically perform countermeasures to redirect attackers away from your backend. For example, if your site relies on edge computing for dynamic tasks (such as authentication, gathering user data, or serving the correct version of the site for a given region), you’ll want to leverage your CDN’s bot traffic protection to prevent takedown attempts from exploiting your provider’s concurrency restrictions.
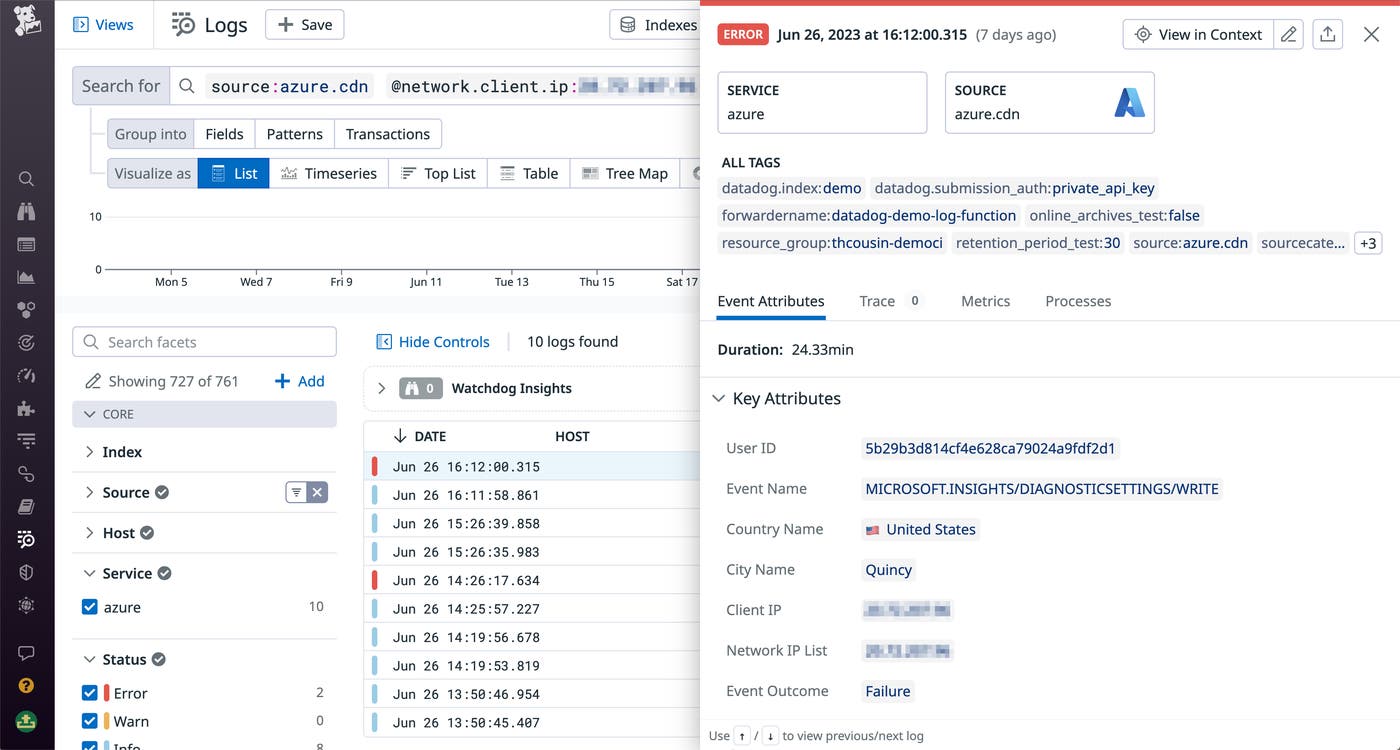
CDN providers like Fastly and CloudFlare emit events and other logs signaling their responses to malicious activity. By alerting on these, you can keep your team aware of security threats and respond quickly to secure the rest of your infrastructure. It’s also important to monitor patterns in your CDN request logs for strange behavior, such as an unusually high number of referrers from a suspicious-looking domain or repeated hotlinking to assets, for further insight into potential browser attacks. Then, you can configure your CDN’s WAF to reject requests from these malicious sources. Once you’ve identified a potential malicious actor, you can filter your CDN traffic logs to their IP address and comb through the results to determine what other actions they took and how your CDN responded. To explore more best practices for monitoring CDN logs to get visibility into application security, health, and performance, see our dedicated blog post for this topic.
Monitor the build-to-deploy cycle
Although static web applications tend to have relatively lightweight backends compared to client- or server-rendered ones, the complexity of orchestrating static apps’ rapid build-to-deploy cycle still introduces significant infrastructure overhead. This overhead includes a chorus of components such as the static site generator, CI/CD tools, version control manager, object storage solution, CMS, and any additional compute instances helping with the build-to-deploy pipeline. In this section, we’ll discuss strategies for establishing and maintaining observability into your static app’s builds and deployments.
Trace and monitor your supplemental build infrastructure
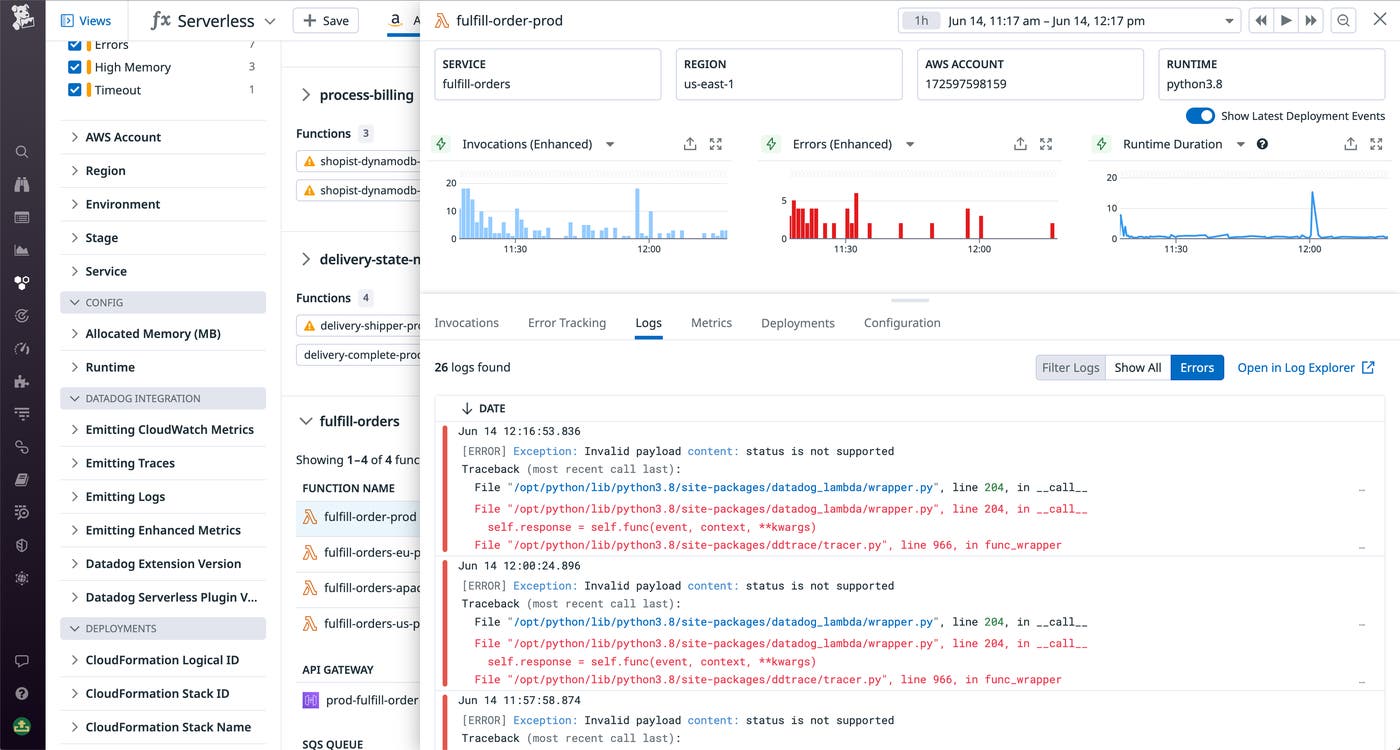
Before your build pipelines can run in order to ship a new version of your app, your new pages need to be compiled and generated. As we discussed previously, static site backends often employ a lightweight (usually serverless) compute layer running logic that helps the static site generator and CMS build pages. These functions can return supplemental data for specific pages, process and validate content, or build additional pages that aren’t handled by the static site generator. For example, you might use a Lambda function to structure the compiled markdown files output by your static site generator in order to store them efficiently in your S3 bucket. It’s important to have visibility into the runtimes of these functions, because errors and latency here can significantly affect the time it takes for the build pipeline to start after a new code change. By ingesting logs from your serverless functions, you can track errors and latency in them, and use queries to correlate this data with slow or failed builds. And by tracing these functions, you can more easily investigate the root cause of errors.
Monitor build pipeline executions
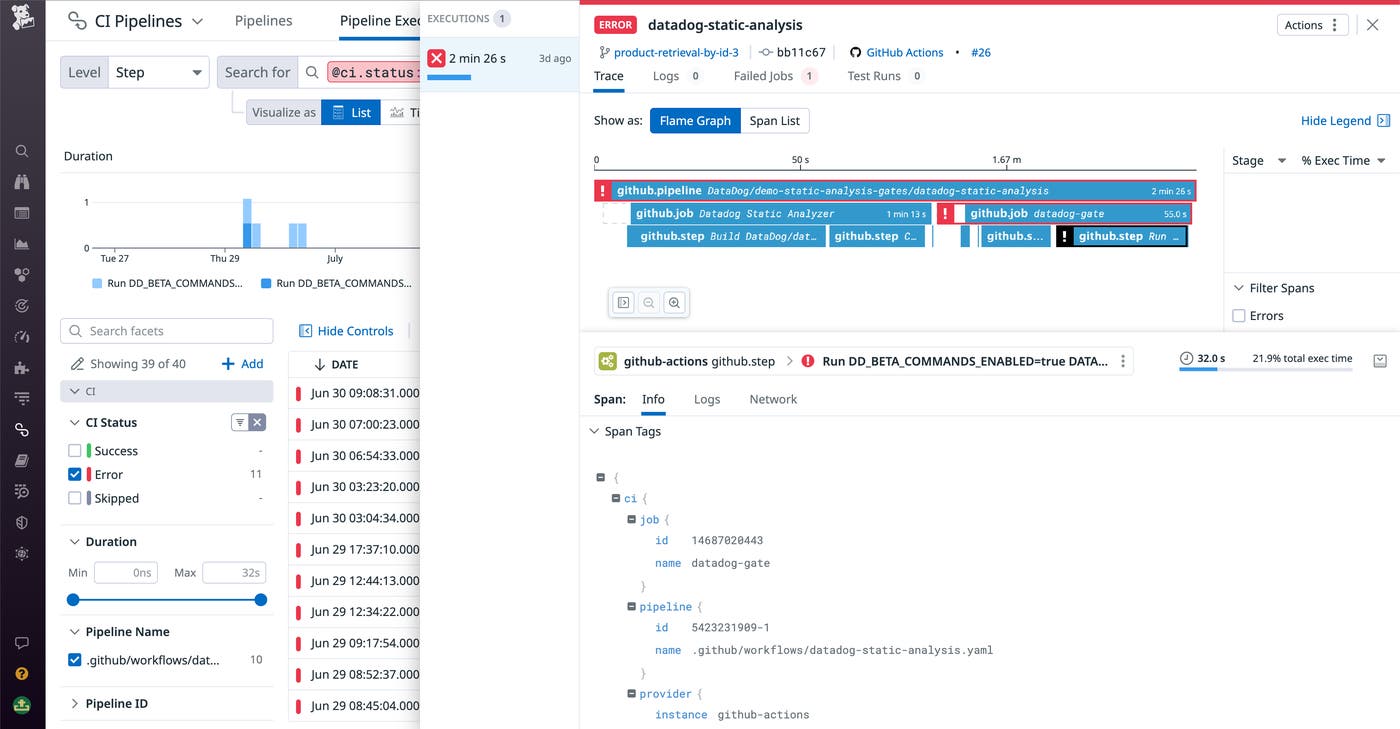
Because every code change or new content upload for your application requires a full rebuild (in most cases), it’s particularly important to monitor your build pipelines in order to quickly identify and troubleshoot pre-production regressions. Your monitoring stack should include integrations with your CI provider—like GitLab, Jenkins, or CircleCI—so you can fully instrument your pipelines. The goal here is to get granular insight into your CI pipeline executions, including each of your pipelines’ constituent stages and jobs. This way, you can easily spot slow or errored jobs and track your pipelines’ performance over time.
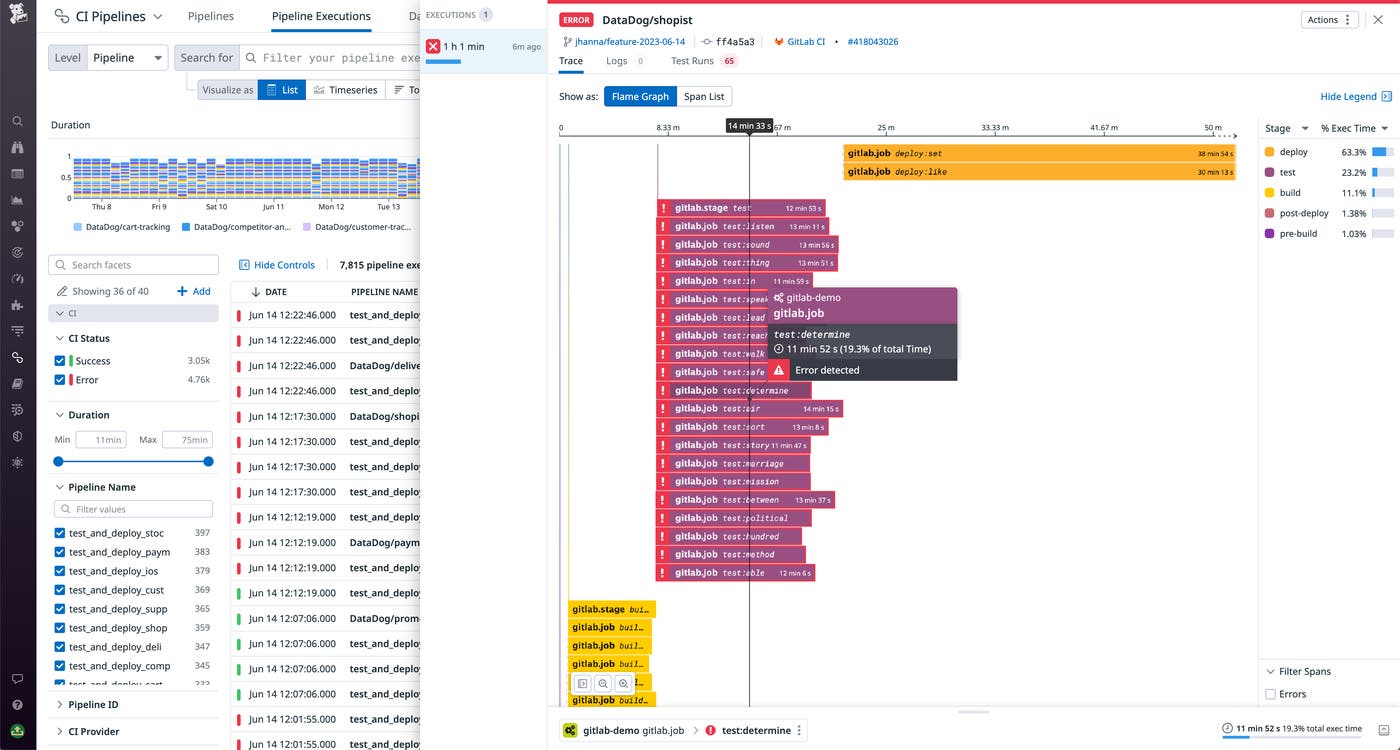
To form further context, you can also add logic to your build routines in order to log details from individual job steps. This can help you track, debug, and alert on key issues such as:
- Is the static site generator compiling your webpage code successfully (e.g., are there YAML errors or JS syntax errors)?
- Did your build pipeline successfully communicate with your object store to push a new version of your code to the correct bucket?
- Were new static assets successfully shipped to your object store?
- Are your pipeline runners triggering jobs successfully or are they failing due to resource overconsumption, rate limiting, etc.?
Maintain healthy testing to avoid deploying regressions
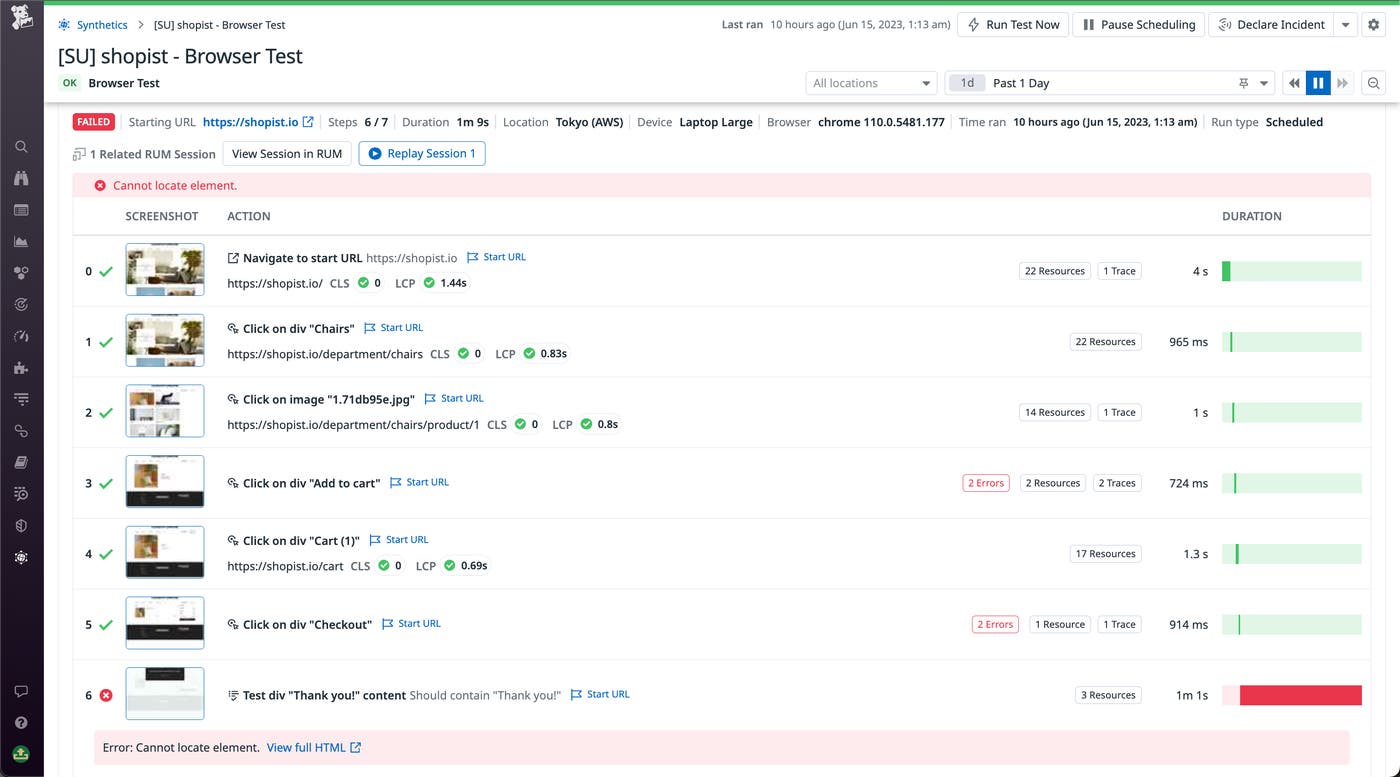
Just like with builds, the rapid deployment cycles fostered by static web architecture make it particularly important to practice rigorous, comprehensive testing. By shifting your testing left with pre-production synthetic tests, you can validate that new versions of your application won’t introduce performance regressions that affect your customers. In particular, you should add synthetic browser and API tests to your staging environment to check for errors and other regressions before triggering a production deployment.
With an API test, for example, you can test whether new assets uploaded from your CMS were successfully sent to your object storage. And by using browser tests, you can test page load times and spot runtime errors in new versions of your site—this way, you can easily roll back changes and resolve errors and latency issues before pushing to production.
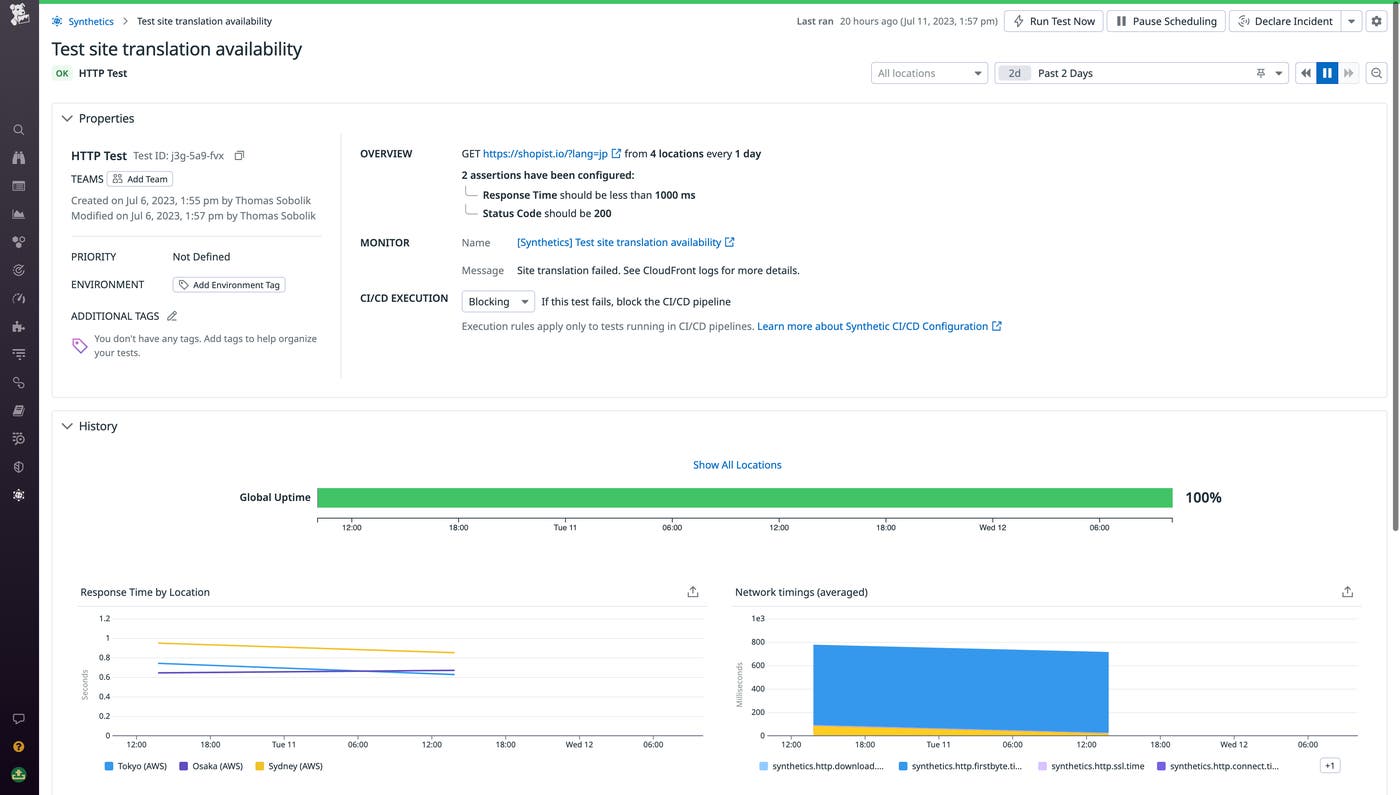
You can also use HTTP testing to validate the health and performance of any other functions that are executing logic during the request lifecycle. For example, many static web platforms take advantage of edge computing to handle dynamic tasks such as serving the correct translation of a page based on the user’s location. You can set up HTTP tests with synthetic requests to these functions to make sure they still work for your new app version.
Monitor your entire static web stack with Datadog
Static web architecture presents a high-efficiency and relatively low-overhead solution for building and deploying many different kinds of web apps. However, it’s paramount to effectively monitor your static web platform to ensure that your app can be iterated quickly, deployed efficiently, and run performantly, and your teams can rapidly deliver fresh content and engaging web experiences to customers. Datadog offers a comprehensive solution for monitoring each layer of your static web stack in a unified platform, including:
- Real User Monitoring for tracing page loads, tracking runtime errors, and ensuring healthy communication with the CDN
- Integrations with many top CDN providers, including Amazon CloudFront, Fastly, and CloudFlare, for logging and metric collection
- A CI Pipeline Visibility tool that integrates with popular services like GitLab and Jenkins and enables you to fully instrument your build pipelines to track errors and latency in each of your builds, stages, and jobs
- Synthetic API and Browser testing that can be integrated into your CI pipelines, along with CI Testing Visibility to surface flaky tests and ensure the efficacy of your pre-production testing
- Serverless monitoring and integrations with popular edge computing and object storage solutions, so that all of the helper functions and additional backend infrastructure your apps rely on can be effectively monitored
By combining each of these key monitoring data sources, Datadog acts as a centralized source of truth in your static web platform for troubleshooting, performance analysis, alerting, and more. For more information about each of these products, see our documentation. Or if you’re brand new to Datadog, sign up for a free trial to get started.


