

Dashboards allow you to visualize and correlate monitoring data from across disparate data sources, technologies, and infrastructure components to understand what’s going on in your environment. In a growing organization, it’s paramount to standardize how teams build their dashboards to ensure their consistency and legibility. As your products scale, it may become difficult for teams to maintain comprehensive, high-quality dashboards that can be easily interpreted by stakeholders and on-call responders. And as your teams expand, it also becomes more important to quickly bring teammates up to speed with new data sources and product areas to ensure uptime.
To meet these challenges, we’re pleased to announce Powerpacks—a new way to scale dashboard expertise through templated groups of widgets. Powerpacks help break down observability silos by giving experts a way to capture and distribute their graphing knowledge across disparate infrastructure components and technologies—while also providing dashboard creators with easy access to that knowledge. In this post, we’ll walk through how you can use Powerpacks to maintain dashboarding best practices and efficiently scale monitoring expertise within your organization.
Manage knowledge with observability building blocks
Powerpacks are templated groups of dashboard widgets you can save from an existing dashboard and turn into reusable packs in the widget tray. Scoped to a dashboard group, Powerpacks provide observability building blocks that balance the customizability of individual widgets with the opinionated content of entire dashboards. In an organization where expertise and ownership are distributed across teams, a well-constructed Powerpack can help teams that own a specific technology (such as Kafka or Postgres) or stake (such as compliance or security) standardize how these components are monitored. This standardization can speed up your organization’s adoption of new monitoring patterns and provide a scalable way to promote monitoring best practices across your organization.
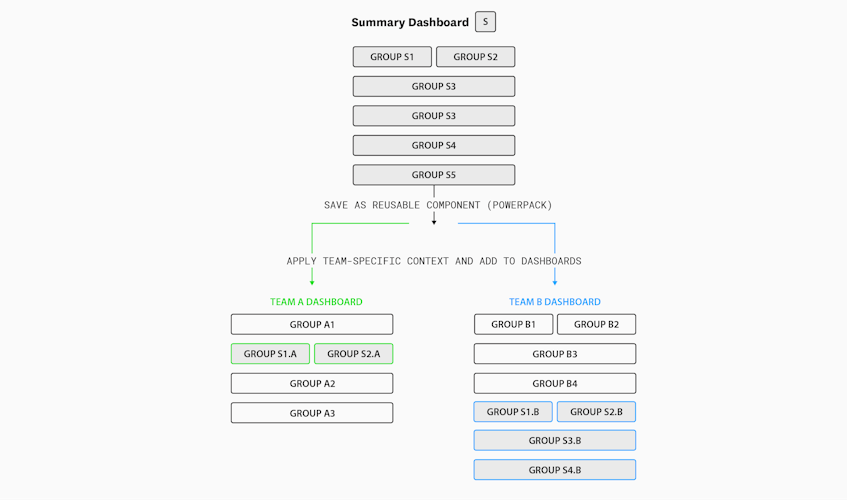
For example, let’s say that due to an organization-wide focus on security, teams are instructed to add a “security” section to their service overview dashboards. As the security team lead, you turn a group of widgets from your team’s main overview dashboard into a Powerpack that groups together security metrics, such as suspicious IPs, detected threats by severity, and security signals grouped by MITRE technique. You can turn any group of widgets in an existing dashboard into a Powerpack by clicking “Save as Powerpack’’ in the group’s header. Once you’ve given your Powerpack a title, description, and tags, team members can easily discover it by entering these keywords in the widget tray search bar.
Scope your data to any context
Just like with dashboards and notebooks, Powerpacks can be configured with variables to enable users to scope their widgets to the data that’s relevant to their teams.
Let’s use the security Powerpack from the previous section as an example. You might want to add configuration variables for facets such as service name and environment so that teams can scope the data to their service and look at attacks from a specific environment. You can set default values for your Powerpack configuration variables to ensure that team members adding your Powerpack to their dashboards will see correctly scoped data. To help you decide which variables to include, Datadog will automatically suggest the most common facets in your widgets’ queries.
Access expertise across teams
Now that your Powerpack is properly named, tagged, and scoped, other teams can easily access your expertise by adding it to their dashboards.
For example, a team owning a checkout service for an online store can simply query for the security tag, select the relevant pack, and filter the data to their service, before finally adding the Powerpack to their service overview dashboard—instantly getting visibility into their security posture. By creating this Powerpack as the security team lead, you’ve standardized which security metrics should be tracked and ensured that security insights in dashboards across your organization will remain consistent and easy to parse.
For a complete guide on the best practices for creating custom Powerpacks, see our documentation.
Quickly create flexible dashboards with out-of-the-box Powerpacks
In addition to creating custom Powerpacks for standardizing key metrics and data sources for specific technologies, you can also choose from a set of out-of-the-box Powerpacks for Datadog products, including RUM, Synthetic testing, Kubernetes monitoring, and infrastructure monitoring. These default Powerpacks can serve as examples for Powerpack creators and highlight effective ways to gain insights into key performance metrics and health signals for these use cases.
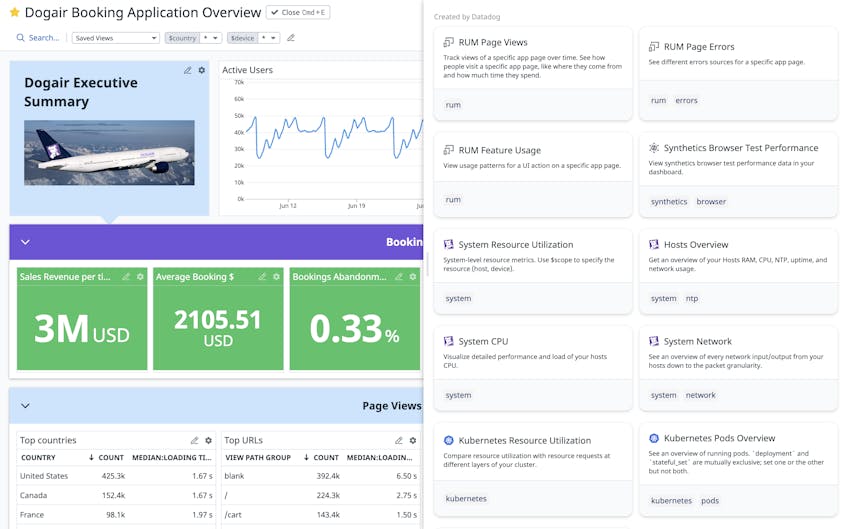
Default Powerpacks supplement out-of-the-box dashboards by showing monitoring best practices in composable blocks that can be incorporated and customized across several dashboards. For example, the RUM Feature Usage Powerpack combines relevant widgets and complex queries to track user behavior and frontend feature usage, and the Kubernetes Pods Overview Powerpack shows currently running Kubernetes pods and which pods are currently in failed or pending namespaces. Your team members can easily clone and modify these Powerpacks to quickly get started building dashboards to monitor their Kubernetes deployments and frontend applications.
Get started with Powerpacks
Using Powerpacks ensures that dashboards are easily interpretable, remain consistent, and contain the relevant context needed to monitor your infrastructure and applications. By empowering your entire organization to build better dashboards, Powerpacks reduce your MTTR in incident response and help you scale monitoring knowledge as fast as your organization scales. Powerpacks are now generally available for all Datadog customers—see the dashboards guide to get started. Or, if you haven’t tried Datadog yet, sign up for a free trial.
