Kai Xin Tai
Tracing has become essential for monitoring today’s increasingly distributed architectures. But complex production applications produce an extremely high volume of traces, which are prohibitively expensive to store and nearly impossible to sift through in time-sensitive situations. Datadog Distributed Tracing already allows you to search and analyze your ingested traces live over a 15-minute rolling window and retain only the ones you need by creating highly flexible retention rules. You can now leverage this stream of traces to generate metrics from any span, using any tag—and track long-term trends in application performance. And because you have full control over your traces, the metrics you create are always accurate and reflective of the state of your system.
Build span-based metrics that are meaningful to your business
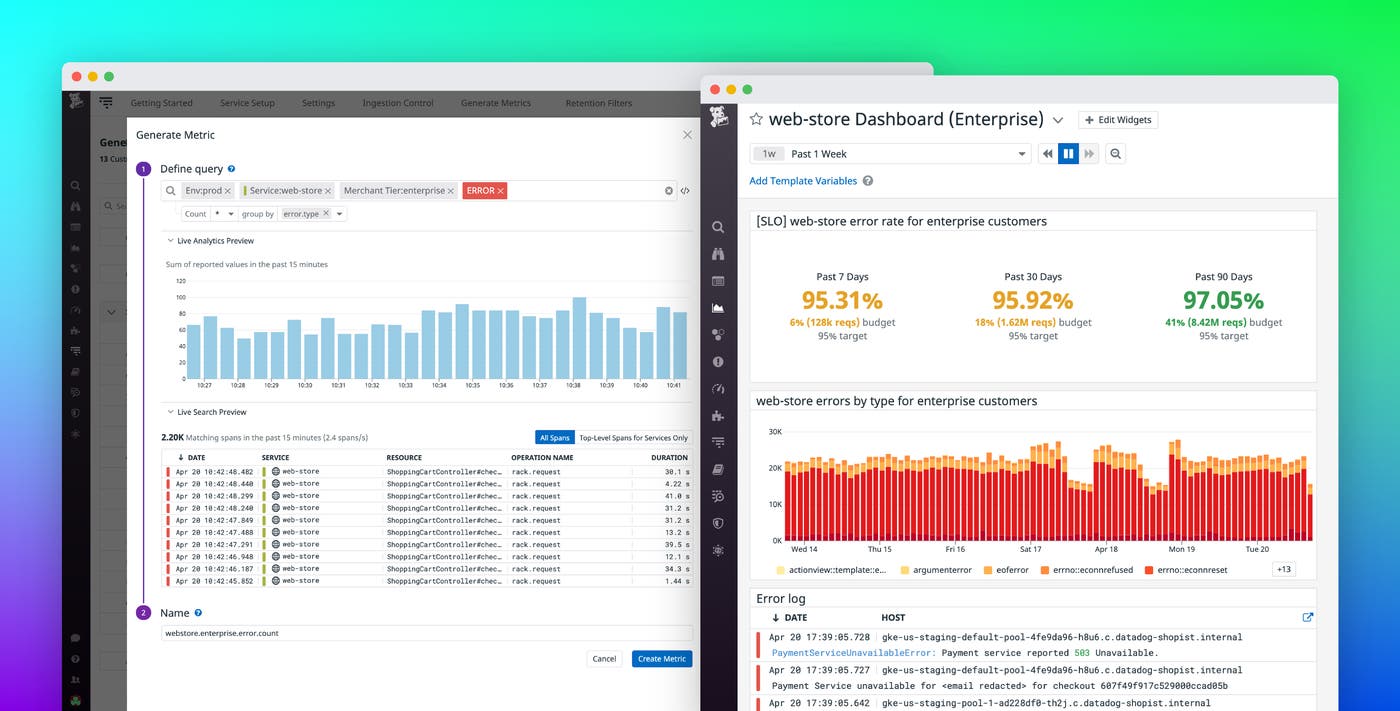
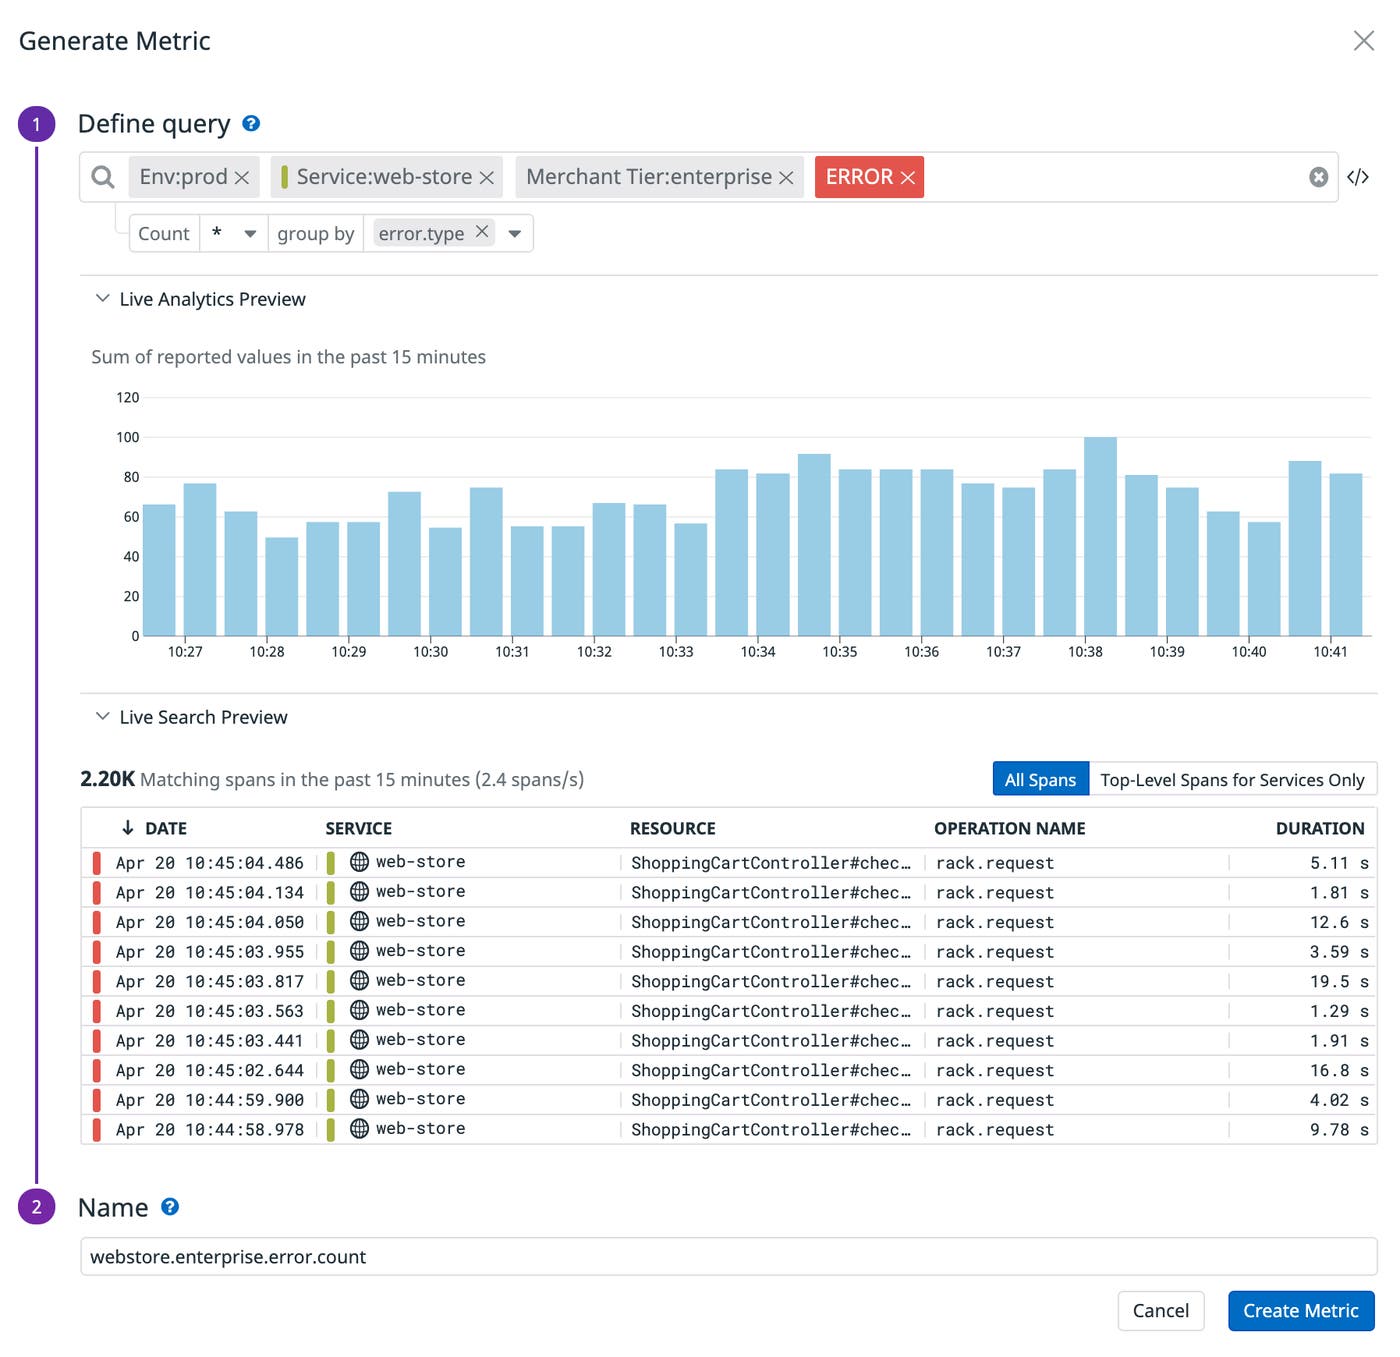
If you’ve used Datadog APM, you might be familiar with Trace Search and Analytics, which lets you use tags to query and aggregate spans across any dimension—whether it’s a specific service, endpoint, customer segment, or a combination thereof. Now, as you’re exploring your spans (and visualizing them as a timeseries graph, top list, or table), you can generate metrics by selecting Export, followed by Generate new metric. In the example below, we’re creating a metric to track the number of errors experienced by our top-tier enterprise customers (webstore.enterprise.error.count). We’ve further grouped this metric by error type so that we can easily determine whether the issue lies within our code, the network, or a different part of our application.
Leverage all of Datadog’s metrics-based functionality
Now that you’ve created your span-based metric, you can leverage all of Datadog’s metric-based functionality to monitor your application’s performance. While Indexed Spans are retained for 15 days by default, span-based metrics are stored at full granularity for 15 months, so you’ll be able to perform historical analysis on your spans long after they have disappeared.
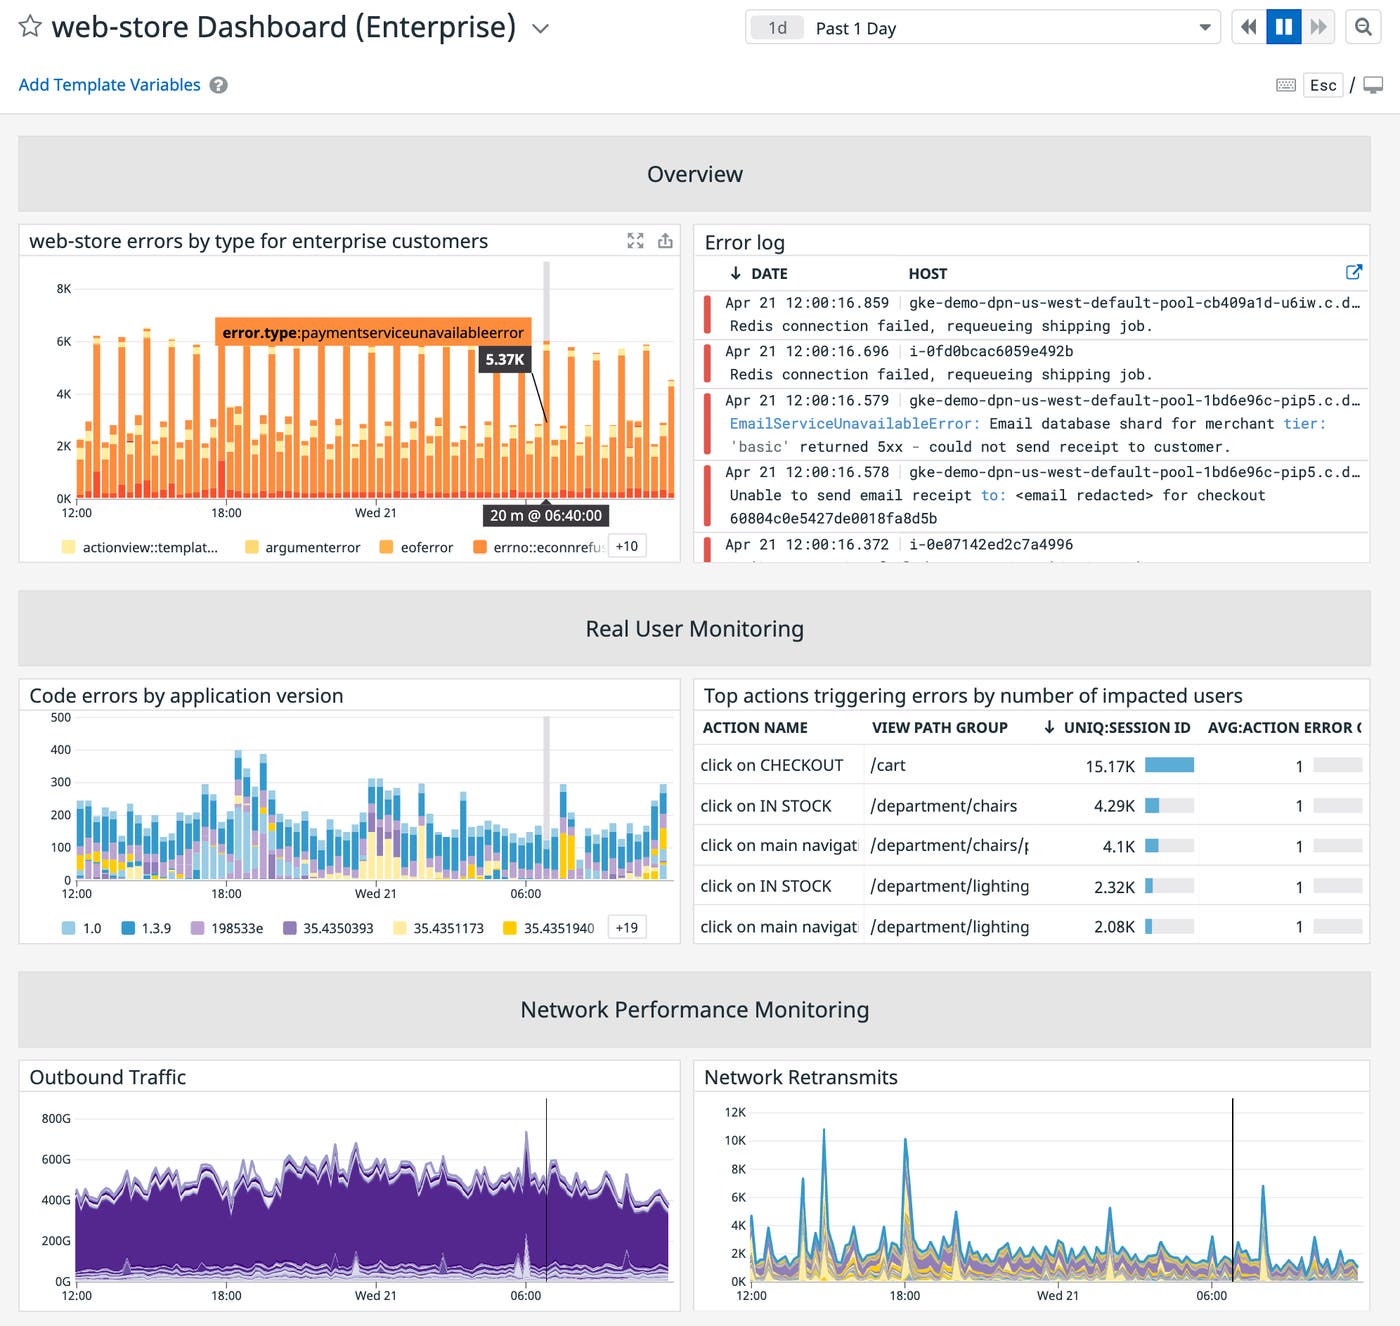
First, you can graph your metric on a dashboard for side-by-side correlation with logs, Real User Monitoring data, network performance metrics, and any other telemetry you’re collecting with Datadog.
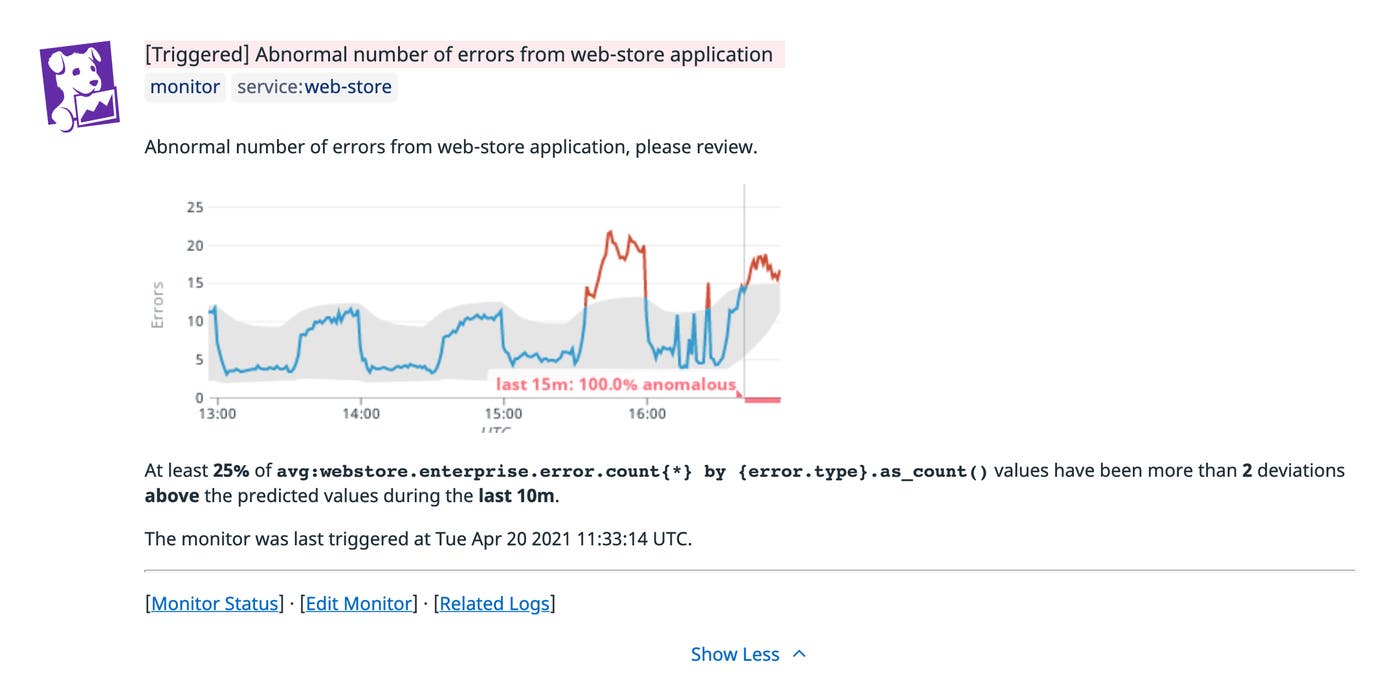
Next, you can configure an alert to be automatically notified of potential issues before they degrade your end-user experience. In the screenshot below, we’ve applied anomaly detection to our webstore.enterprise.error.count metric so that we’ll be immediately informed when its value deviates from its expected range. And even after you’ve created a span-based metric, you can still choose to retain spans that you’re interested in. This way, if your monitor triggers, you’ll have all the contextual information you need to effectively troubleshoot the issue.
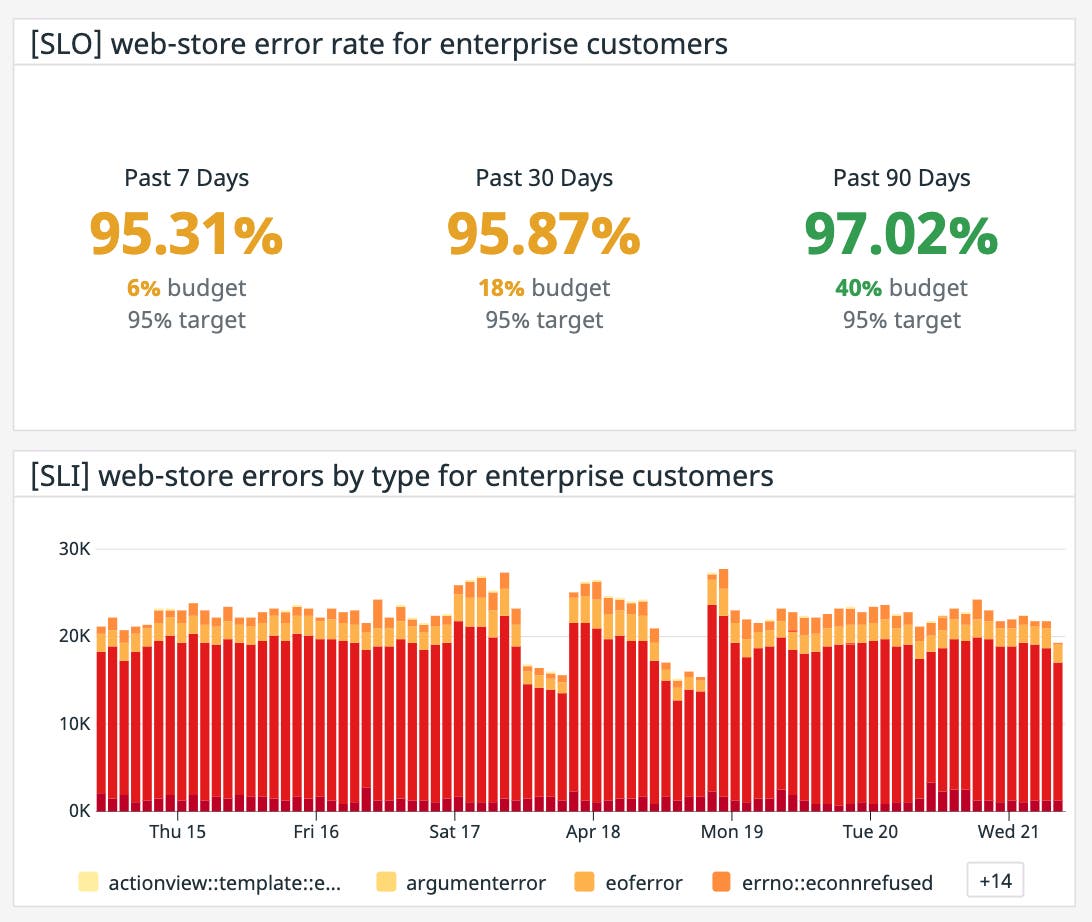
Additionally, you can treat your span-based metrics as service level indicators (SLIs) for establishing service level objectives (SLOs). SLOs define the target value for SLIs and help teams balance feature development with platform stability. You can then share the real-time status of those SLOs with external stakeholders to set expectations about how your service will perform. See our blog post on SLO best practices for more details on creating metric-based SLOs.
Derive insights from all of your spans in a cost-effective way
Modern applications can generate thousands of spans every minute, which means that important spikes or dips in performance indicators can easily get lost in the noise. Generating span-based metrics helps you keep close tabs on how your applications are performing over time, while minimizing the costs associated with retaining and managing all of those spans. Check out our documentation for more information on creating span-based metrics. Or if you’re not yet using Datadog, you can get started with a 14-day free trial today.
