The complexity of microservice architectures can make it hard to determine where an application’s dependencies begin and end and who manages which ones. This can pose a variety of challenges both in the course of day-to-day operations and during incidents. Lacking a clear picture of the ownership and interplay of your services can impede accountability and cause application development, incident investigations, and onboarding processes to become prolonged and haphazard.
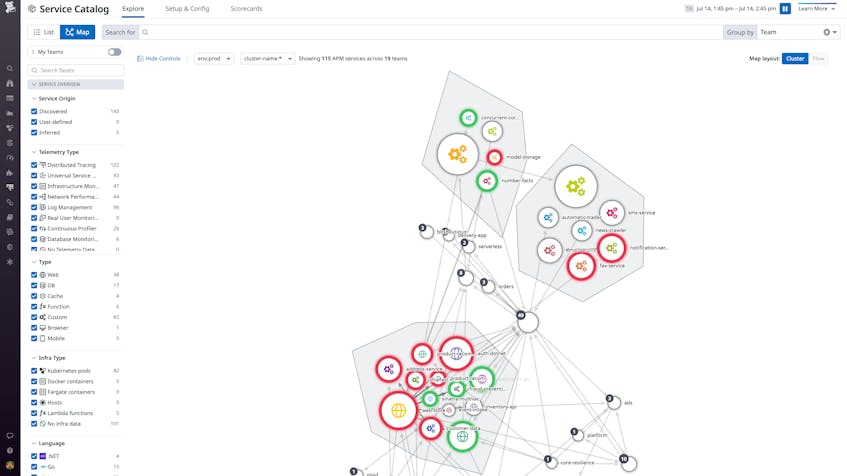
To prevent these difficulties, the Datadog Service Map now allows you to visualize service ownership and application boundaries. This visualization enables everyone in your organization to quickly grasp your evolving system architecture, helping you coordinate routine development as well as incident response.
In this post, we’ll discuss how the Service Map helps you:
- Streamline development and oversight of your applications
- Quickly home in on key service data during incidents
Streamline development and oversight of your applications
Datadog APM and Universal Service Monitoring (USM) users can now use the Service Map to access a clear picture of service ownership and application dependencies within their systems. Once you’ve added team and application metadata to your services in the Service Catalog, you can group the Service Map by these categories in order to reconfigure its topology accordingly. This enables you to quickly visualize the scope of users’ and teams’ oversight of different parts of your microservice architecture—helping you clarify ownership, ensure accountability, and quickly identify “orphan” services.
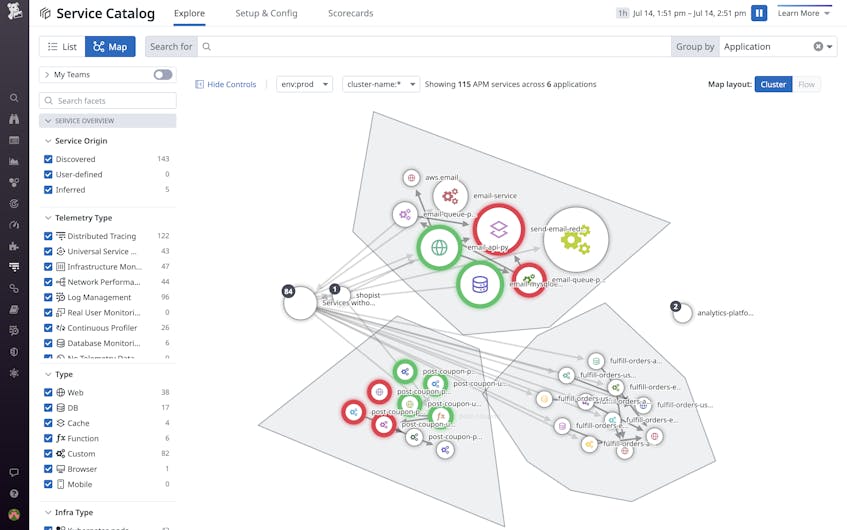
Grouping the Service Map by application enables you to clearly map your applications’ dependencies and interconnections (i.e., if and how they share services), centralizing expertise on your microservice architectures so developers can quickly grasp and analyze them. This can help you streamline application development and oversight, as well as speed up your onboarding processes.
Quickly home in on key service data during incidents
When an incident arises in a microservice-based system, troubleshooting workflows can easily get bogged down in complexity. Incident response can get especially tricky when dependencies are shared by multiple applications and utilized by a variety of teams. Even under the best circumstances, the sheer intricacy of microservice architectures can make it difficult to determine dependencies and the ownership of interdependent services. As a result, coordination between teams can be hindered and incident response prolonged.
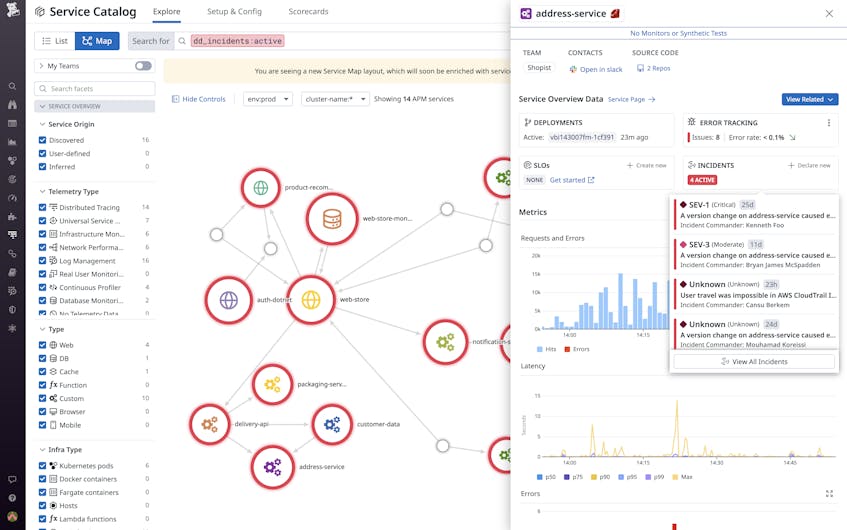
In conjunction with Datadog Incident Management, the Service Map allows you to filter your APM service topology by incident status to isolate any services involved in ongoing or resolved incidents. You can also pivot to an application-specific view to pinpoint the services and data flows at issue in incidents affecting specific applications.
Selecting any node in the Service Map will open a side panel that includes key information from its Service Page, including incident data and resources from Datadog Teams that can help you seamlessly coordinate with service owners during incident response.
Centralize expertise on your services
By visualizing service ownership and application boundaries, the Datadog Service Map enables you to de-silo in-depth knowledge of your applications and their dependencies. This can help you streamline development, incident management, and onboarding processes.
Datadog APM users can get started with the enhanced Service Map today. If you’re new to Datadog, sign up for a 14-day free trial.


