Serverless developers are undoubtedly familiar with the challenge of cold starts, which describe spikes in latency caused by new function containers being initialized in response to increasing traffic. Though cold starts are usually rare in production deployments, it’s still important to understand their causes and how to mitigate their impact on your workload.
It’s also important to understand the separation of duties between you and your cloud provider when assessing a complete cold start lifecycle. AWS fully manages the creation of new execution environments when Lambda functions are first invoked, limiting some of your control for mitigating cold starts. However, you do have control over how your Lambda functions are configured and the compute resources they can access. You also have control over your functions’ initialization code which imports libraries and dependencies and establishes connections to other services. By identifying when and where cold starts occur, you can identify unneeded dependencies, lazy load modules which may not be required, and tightly scope module imports to reduce cold start overhead.
Datadog Serverless Monitoring already detects cold starts in Lambda functions, visualizes their impact on services through distributed traces, and allows you to create alerts based on the rate they occur. Serverless Monitoring also provides support for AWS Lambda SnapStart, which helps reduce cold starts in Lambda functions running the Amazon Corretto 11 Java runtime.
Now, we are pleased to announce that we are further helping developers visualize, understand, and mitigate cold starts with Cold Start Tracing via Datadog Serverless APM. In this post, we’ll look at how Cold Start Tracing helps identify root causes behind cold starts and provide actionable insights that you can use to improve your functions’ underlying code to optimize performance and reduce costs.
Optimize Lambda function code with cold start traces
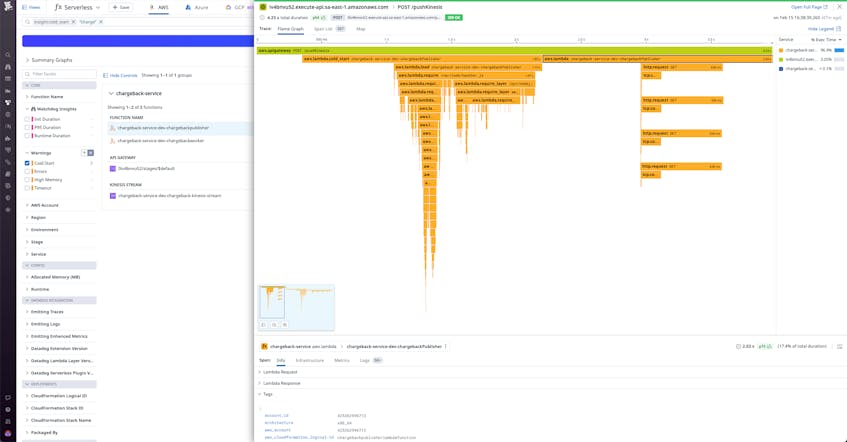
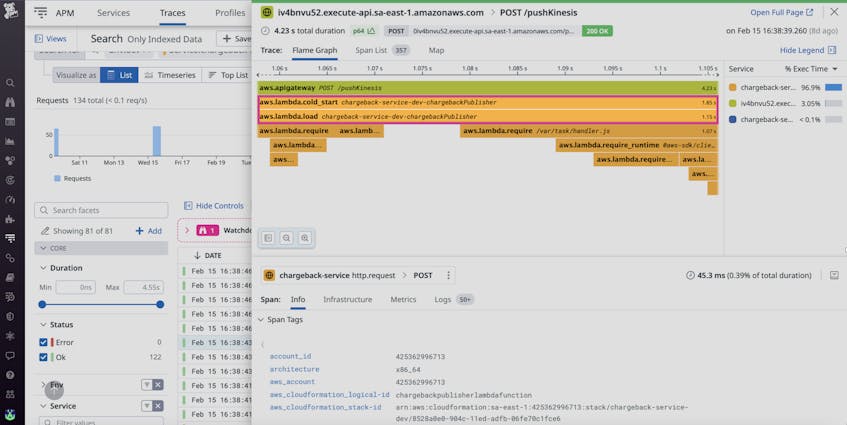
Cold start traces provide an under-the-hood view of the dependencies loaded throughout the duration of a cold start by visualizing these processes as spans on a flame graph. These spans represent the steps executed during a function cold start and can help you determine which step or process is contributing most to a cold start’s duration. For example, in the screenshot below we can see the aws.lambda.load span for a Lambda function named chargeback-service-dev-chargebackpublisher is more than half the length of its parent cold start span, which tells us that the majority of the cold start is due to downloading and interpreting different libraries and modules.
These traces enable you to go beyond simple cold start detection by identifying the parts of your functions’ code that may be contributing to cold starts. For instance, you may have a cold starting Lambda function with initialization code that imports a large volume of libraries. By viewing the cold start traces associated with that Lambda function, you can see which library takes the longest time to download and contributes the most to the cold start duration.
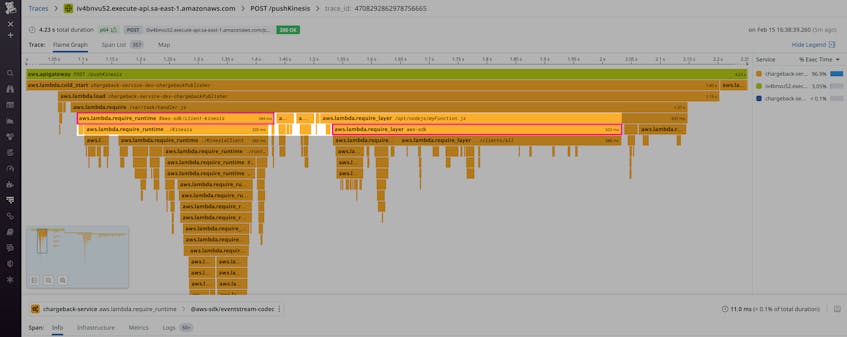
Let’s say an engineer bundles a pinned copy of the AWS SDK as a Lambda layer along with other shared dependencies. Later, another engineer sees that AWS SDK v3 is now automatically bundled with Node18 and chooses to import that version instead. Visualized in the screenshot below, the function is now importing two distinct copies of the same library for a total increase of ~400 ms in cold start time. You can determine whether downloading this library is necessary upon initialization; if not, you can cut down on cold start duration by lazy loading it instead.
Cold Start Tracing also identifies where dependencies are loaded. In Lambda, a dependency like the AWS SDK is available in the runtime. Users can also package dependencies as Lambda layers or simply bundle them alongside function code.
Each of these packaging mechanisms comes with pros and cons, and Cold Start Tracing helps developers weigh the impact on function cold starts against the other factors.
Fine tune your Lambda function configurations
Another benefit of cold start traces is that they enable you to test any changes you make to your Lambda function configurations which, in addition to refactoring your Lambda functions’ code, can help mitigate cold starts. For example, in an effort to cut down on the duration and occurrences of cold starts, you might take steps such as allocating more memory to your Lambda functions or enabling provisioned concurrency. Then you can view your functions’ cold start traces to test the efficacy of those mitigating steps.
Start using Cold Start Tracing today
Cold Start Tracing is currently available through Datadog Serverless APM. By tracing cold starts, you can identify their root causes, gain insight into how to mitigate them, and improve the performance of your serverless functions. Cold Start Tracing currently includes support for Lambda functions written in Node.js and Python with support for more runtimes coming soon.
If you aren’t already using Datadog, sign up for a 14-day free trial.


