


Jordan Obey
Serverless architectures remove the need to provision and maintain infrastructure components like servers and containers, so developers can focus on writing and deploying code. However, serverless architectures also introduce new challenges to monitoring and observability. Teams building serverless applications can iterate quickly and deploy frequent code and configuration changes, making it difficult to track what impact these changes have on your applications. Any adverse effects a code or deployment change might have on your applications can easily go unnoticed until it’s too late to prevent negative impacts reaching your customers. To meet this challenge, Datadog serverless monitoring includes Deployment Tracking so you can easily correlate serverless code, configuration, and deployment changes with metrics, traces, and logs from your functions for real-time insight into how these changes may affect the health and performance of your applications.
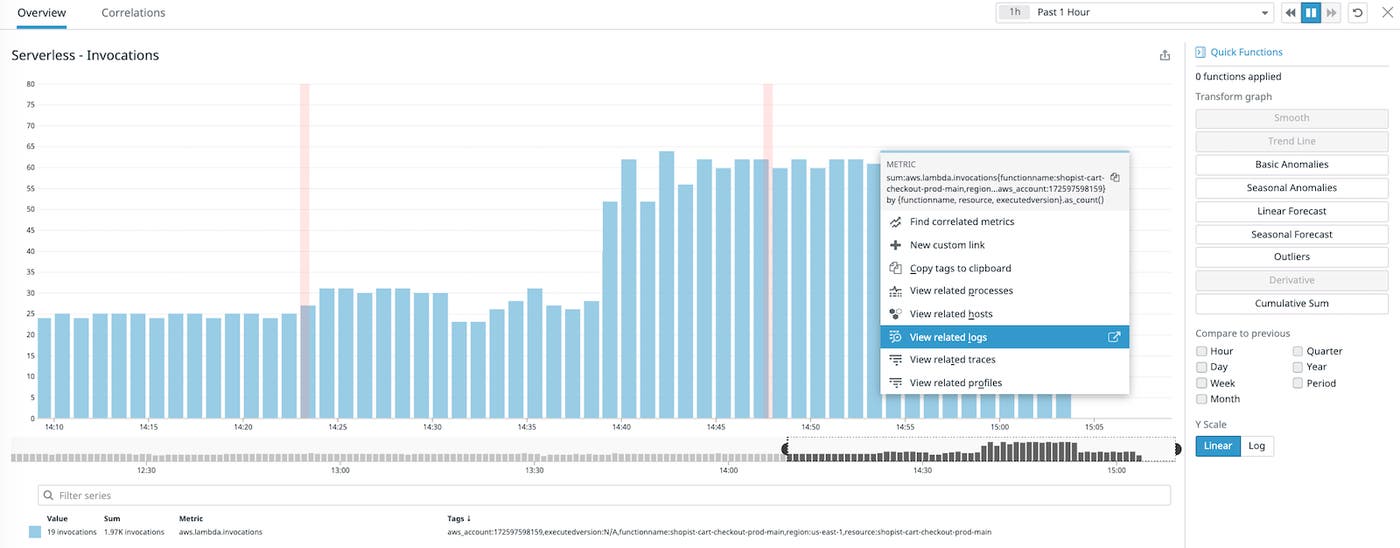
Correlate serverless metrics and events
To access Deployment Tracking for your functions, select a function in the Serverless view and click the “Deployments” tab. Here you can see key serverless metrics like invocations, execution duration, and error counts automatically displayed with event overlays that mark code deployments and configuration changes related to the function.

For example, if you’ve recently deployed an updated version of a feature, or reconfigured a Lambda function to use less memory, those changes will appear as red bar markers on your serverless metric graphs at the time the event was triggered. This makes it easy to see at a glance if a change has significantly affected that function’s performance.

To investigate a function’s performance further, click a point on the graph to drill down into related traces or logs.
And, because Datadog automatically tags each Lambda function with key metadata like functionname and executedVersion, you can easily filter your functions to see, for example, how a change affected different versions of the same function.
Quickly summarize serverless activity
Datadog’s Serverless Deployment Tracking view also automatically shows a summary of the activity of your serverless functions within a specified timeframe (e.g., the last 30 minutes) that includes key information like a count of change events broken down by type (including deployments and configuration updates), as well as the net change in a function’s error rate and duration since the most recent change. This summary provides a high-level overview of the state of your serverless functions. For example, if you notice a sign of degraded application performance, like a 50-percent increase in errors since the last triggered event, you can quickly investigate the error graph to identify when the errors started to occur and which functions experienced them.

Detect stack drift with configuration events
To update your serverless stack, it’s considered best practice to begin by modifying your CloudFormation templates and then use a deployment tool like the AWS Serverless Application Model (SAM) or the Serverless Framework to create a change set. This allows you to review changes to your stack before you roll out an update, helping ensure that your configuration accurately reflects the state of your applications. Making changes manually (i.e., without first modifying your template) can increase the chances that your stack will drift, or fall out of sync with your resources. Stack drift introduces inconsistencies in serverless environments and makes it harder for developers to manage changes because the actual state of their application won’t match its template configuration, which means they won’t be able to trust their code configurations as a source of truth.
Datadog’s Deployment Tracking view includes an events table that lists each triggered event associated with a given function and when it occurred. The events table also lists the user that initiated each configuration and deployment event, so you can easily see whether it was done by an automation tool like CloudFormation, or manually by a developer. If you do detect stack drift, this makes it easy to identify who initiated the most recent deployments so you can determine what changes should be rolled back.

Monitor every step of the serverless deployment lifecycle
Datadog’s integrations with serverless application bootstrapping tools like AWS Serverless Application Model (SAM) and AWS Cloud Development Kit, deployment management services like AWS CodeDeploy, and continuous integration tools like AWS CodeBuild, CircleCI, Travis CI, and Jenkins give you a full view of your serverless ecosystem from a single pane of glass. And now, with Deployment Tracking, you’ll have insight into how code, configuration, and deployment changes affect function performance, so you can troubleshoot effectively.
If you already have a Datadog account, you can enable Deployment Tracking for your serverless code and configuration changes by adding the cloudtrail:LookupEvents permission to your Datadog AWS integration. Also be sure to check out the discussions taking place in the #serverless channel on Datadog’s Slack community, and read more about Deployment Tracking here.
If you don’t have a Datadog account, sign up today for a 14-day free trial.


