

Last fall during re:Invent 2013, Amazon Web Services released CloudTrail, a log of key events and configuration changes of AWS services. You can use this log not only as an audit trail to enforce compliance, but also as a key data source to understand your application & infrastructure performance.
CloudTrail events can be essential to understand unexpected changes in application & infrastructure performance. Maybe EC2 instances were spawned with the wrong type or configuration or a load balancer was provisioned with an incorrect number of backends. In many cases getting that extra insight is very helpful to get to the bottom of a performance issue.
CloudTrail stores these events in a series of log files in S3. Log files are helpful to understand the sequence of events, but you need to do extra work to extract these events and correlate them with the rest of your performance metrics.
Datadog does that work for you. We’re pleased to make this process easy and to enable highly visual correlation analysis of CloudTrail events with performance metrics through a new integration with AWS CloudTrail.
How Datadog enhances CloudTrail logs
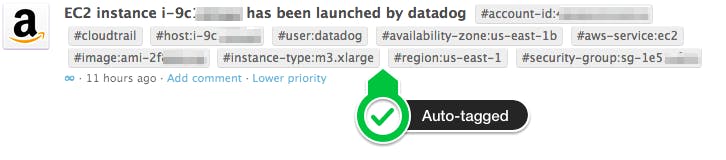
After the set-up of the Datadog AWS integration, Datadog collects a subset of CloudTrail logs from S3. Once brought into Datadog, CloudTrail logs will immediately show up as events in Datadog’s Events Stream and are available for an entire team to view and comment on.
To zero in on CloudTrail events in Datadog, pick “Amazon Web Services” on the left-hand side column of the Events Stream.
CloudTrail logs are indexed and tagged with metadata inherited from AWS such as the region, availability zone, instance type, security group, etc. to make finding specific CloudTrail events easier.
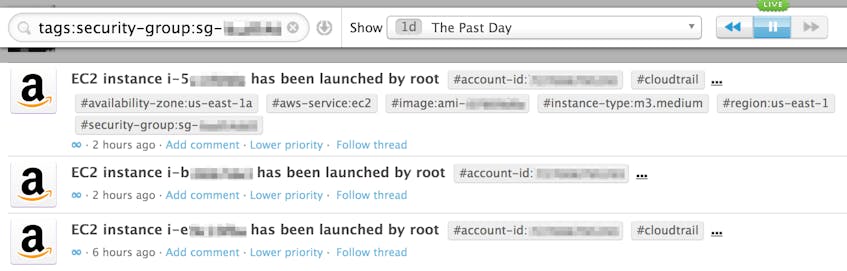
You can search for any event using more sophisticated queries. In this example, we show a list of past CloudTrail events tied to a given security group with the query: “tags: security-group:sg-xxxyyyzzz sources:aws”.
Understand the performance impact of AWS changes
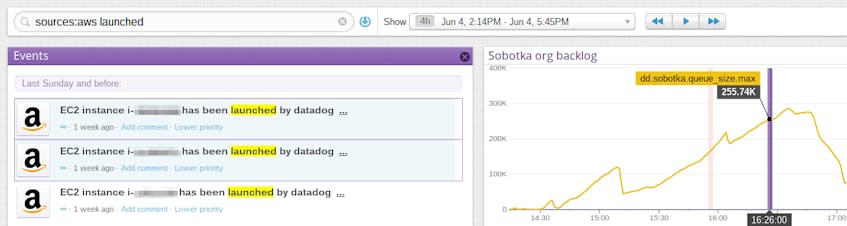
Since Datadog indexes CloudTrail logs, you can overlay AWS CloudTrail events on any graph for any metric to look for correlation between changes in the AWS environment and changes in application performance.
In the example below, on the left-hand side you can see the search for “sources:aws launched” has found three EC2 instance launches recorded by CloudTrail. The right-hand side is the graph of a “backlog” metric that is dangerously increasing. The instance launches are marked as vertical bars on the graph.
Datadog makes the correlation between launching EC2 instances and the size of the backlog clear: once all three instances have been launched to consume that backlog, it subsides.
Troubleshoot issues with your team
Datadog’s Events Stream provides a platform for collaboration. All events can be used to start a conversation by simply mentioning another user’s name. In this example, one of the users asks for help about a failure to launch new EC2 instances, by mentioning @user in the event’s comment section.
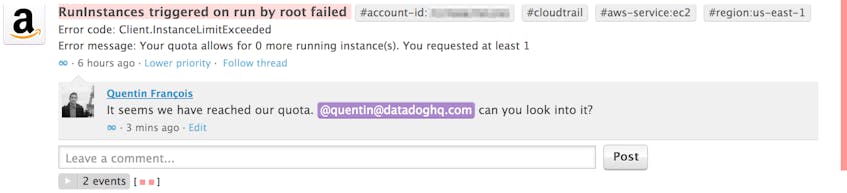
This can also be used to broadcast notifications through messaging systems like PagerDuty and OpsGenie or chat platforms like HipChat and Slack.
If you want to better understand the performance of your applications on AWS with CloudTrail, Datadog is available with a fully-featured 14 day free trial. CloudTrail logs and CloudWatch metrics will be immediately available after connecting the AWS integration.
