Arthur Wang
Datadog alerting is designed to be transparent and actionable, giving you the flexibility to design targeted alerts and detailed, contextual runbooks. However, your monitoring coverage likely also includes some general, catch-all alerts to cover unanticipated issues. So where do you start when you receive a sweeping alert notification like “System load is high on host:i-abcd1234”?
We’re excited to announce the addition of the host summary panel, which is a new tool to simplify the process of troubleshooting ailing hosts. The host summary panel is accessible from the Datadog Infrastructure page, and presents panoramic, out-of-the-box views of every metric Datadog collects for each host, grouped by integration, or application.
With hundreds of metrics per host, you might not want to alert over every metric. Scanning through a host’s summary panel is a quick way to identify patterns and find correlations among host metrics. In this post, we’ll describe the process of using the host summary panel to troubleshoot an alert.
Troubleshoot ambiguous alerts with host summary panels
Say you’ve received a “System Load is high on host:i-abcd1234” Datadog alert. System load is a fundamental but ambiguous metric: a warning signal with an array of potential causes.
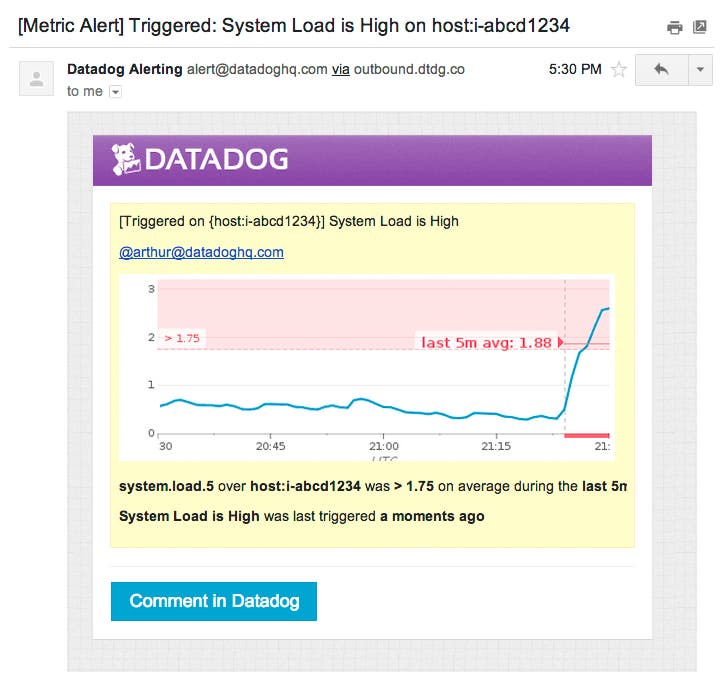
As a first step, we can check the Datadog Infrastructure page to gain insight into this node’s role and behavior.
Scan host summary panel to begin investigating an incident
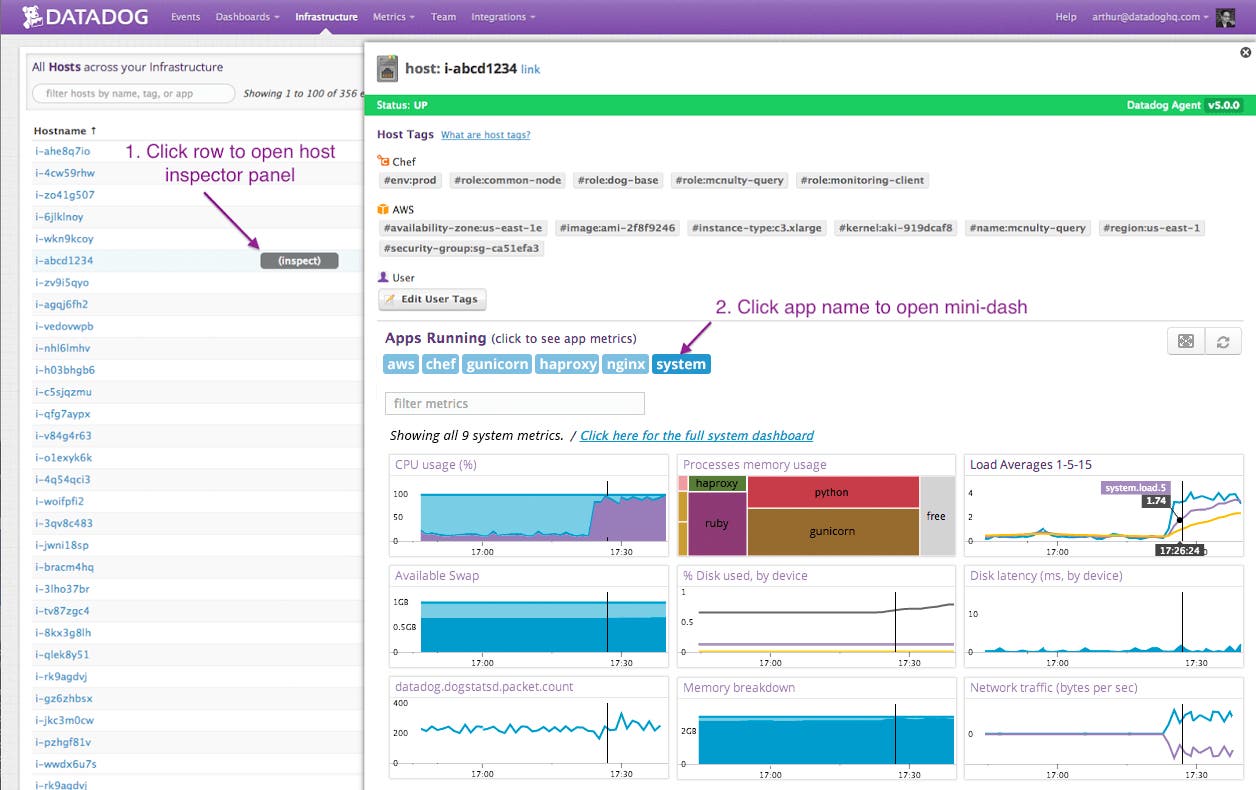
Based on the host tags automatically added by AWS and Chef, and the list of apps/integrations (Gunicorn, HAproxy, and NGINX) associated with this host, we know right away that it’s a web-tier node. You can open a host summary panel scoped to the integration on the host by clicking each integration in this list.
By looking at the “system” host summary panel associated with host:i-abcd1234, we confirm that system load has been spiking for the past ten minutes. On the same panel, we also see that user CPU usage and network traffic have also increased precipitously.
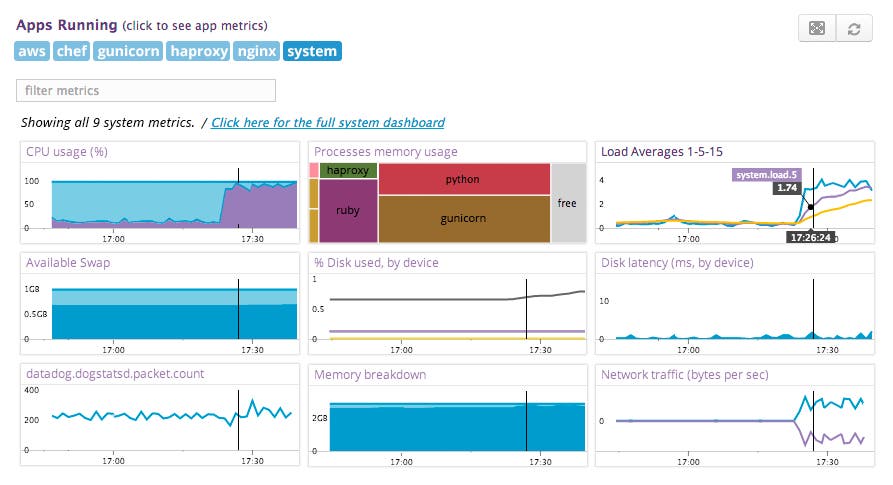
Without leaving the Infrastructure page, we can look for metric behavior correlated with a host’s high load over the alerting timeframe by cycling through the rest of the host’s summary panel.
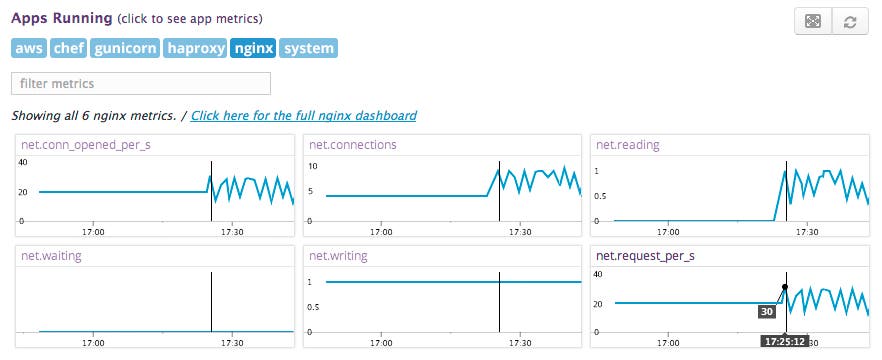
Correlate metrics with the host summary panel
On the NGINX host summary panel, nginx.net.request_per_s has been spiking for the past 10 minutes. This metric timeseries suggests that the high system load and user CPU is not the result of a misbehaving host, but rather one that’s handling an excessive number of requests. This burden could be caused by an issue with AWS auto-scaling configuration, load balancing, or an unexpected burst in traffic, perhaps due to the Slashdot Effect. Now that you know you’re receiving more traffic, you might scale up your web infrastructure, add caching, and take other measures to handle an increased volume of requests.
The host summary panel is a convenient tool for visualizing host overviews and supplementing monitoring coverage. Furthermore, with the insight gained by investigating a general alert, more targeted, robust alerting coverage could be designed to streamline responses to similar issues. For panoramic infrastructure visualizations and rich alerting features, sign up for a free 14-day Datadog trial.


