Kai Xin Tai
SAP delivers a suite of solutions for managing business operations, such as enterprise resource planning (ERP), customer relationship management (CRM), and supply chain management. Many of these solutions, including SAP S/4HANA, run on top of the SAP NetWeaver application development and integration platform. Enterprises and SAP managed providers often operate hundreds or even thousands of SAP NetWeaver systems, and Agentil provides a centralized, low-overhead way to monitor their entire fleet.
We’re excited to announce that Agentil’s SAP NetWeaver integration is the latest offering on the Datadog Marketplace. Now, you can visualize and analyze SAP NetWeaver telemetry data alongside that of any of our 1,000+ integrations in order to easily detect and troubleshoot issues anywhere in your environment.
In this post, we’ll go over how the SAP integration allows you to :
- Get a high-level overview of all of your SAP NetWeaver systems
- Alert on transactional and queued RFC errors
- Troubleshoot increased dialog response time
Get a high-level overview of all of your SAP NetWeaver systems
Agentil connects remotely to SAP NetWeaver, so you can quickly get up and running without having to first install an agent. Once you’ve configured Agentil to forward data to Datadog, you can begin monitoring your SAP NetWeaver systems with two out-of-the-box dashboards. First, the SAP Global Overview dashboard provides a bird’s-eye view of the health and performance of your entire SAP NetWeaver suite.
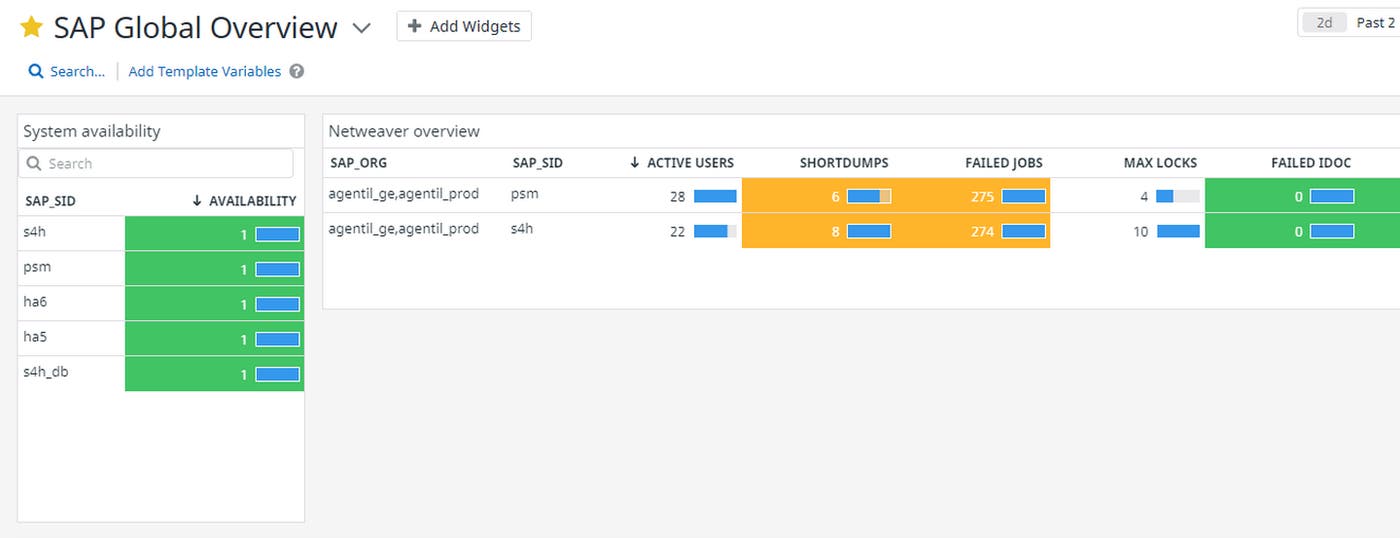
As you can see from the screenshot above, this dashboard displays the availability status of all of your systems, so you can quickly identify and troubleshoot those that are unavailable in order to minimize downtime. It also lets you track job and Intermittent Document (IDOC) failures, as well as short dumps, which are all signs of data transfer and runtime issues. For a more comprehensive view of your stack, you can clone and customize this dashboard to include metrics from other components, such as SAP HANA.
Dive deeper into SAP NetWeaver performance issues
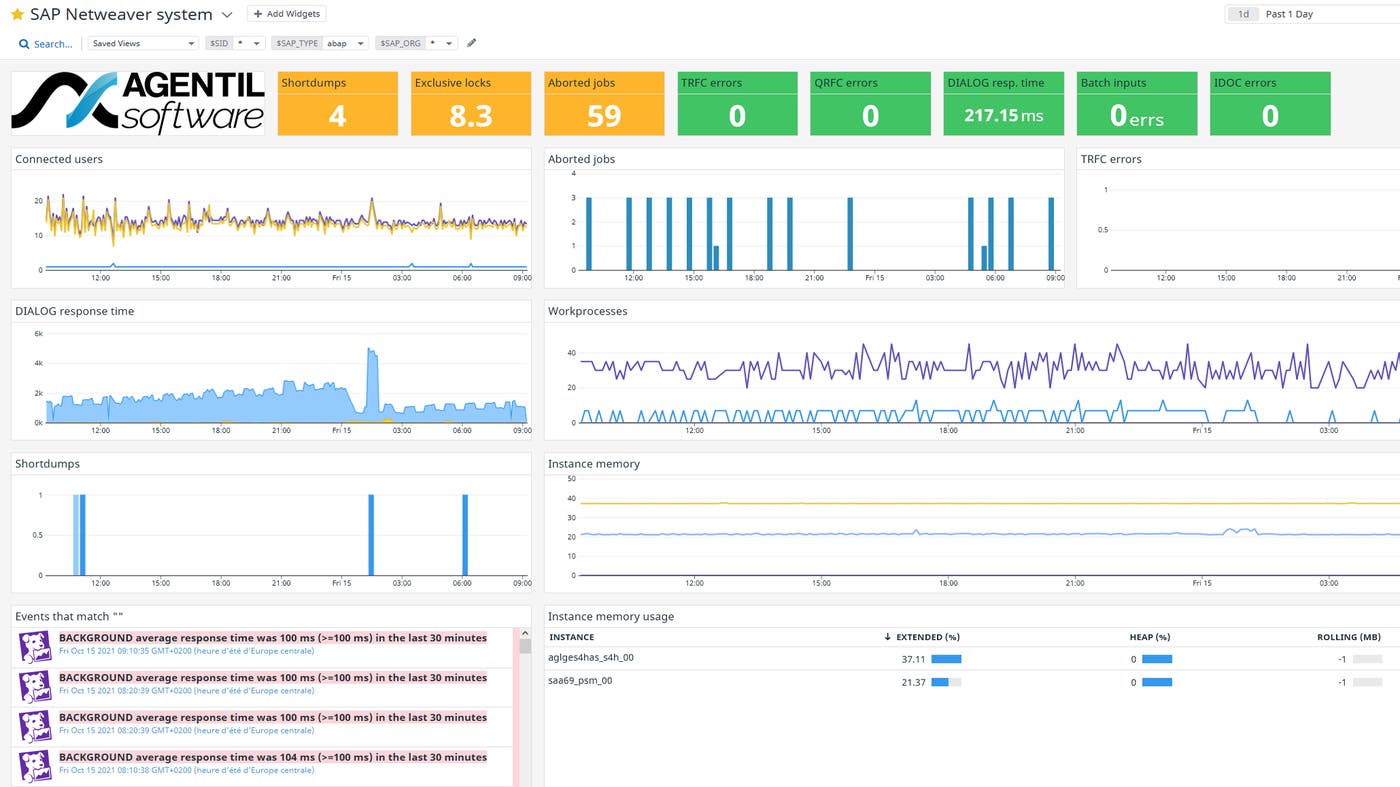
The second out-of-the-box dashboard, SAP NetWeaver system, allows you to scope your data with the $SID (SAP System ID) template variable for a more in-depth look into each of your individual SAP NetWeaver systems. From this dashboard, you can not only see how busy your system is and how much memory it is consuming, but also pinpoint performance issues such as increases in RFC errors and dialog response time. We’ll take a closer look at these two metrics in the following sections.
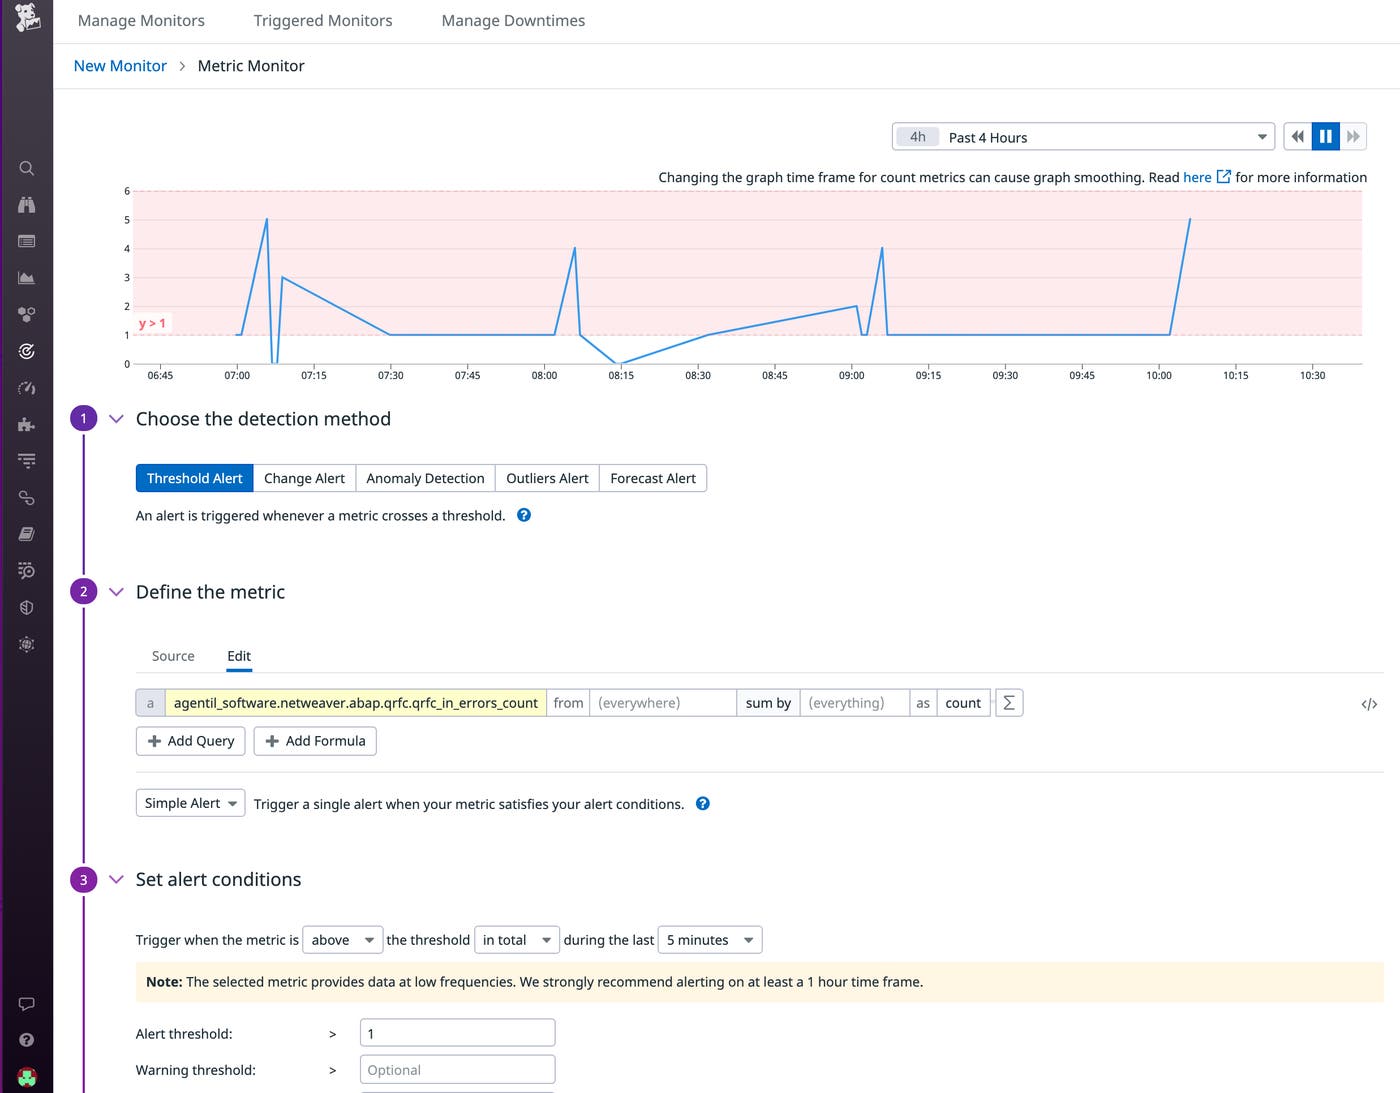
Be alerted of transactional and queued RFC errors
SAP systems communicate with each other via an interface known as the Remote Function Call (RFC). There are several implementations of RFC, and two of the most common are transactional RFC (tRFC) and queued RFC (qRFC). The tRFC variant provides greater data transfer reliability by ensuring that every function call you issue is only executed once against the target server. It also guarantees that all calls within a Logical Unit of Work (LUW) are executed in a single transaction (i.e., they are either all executed or rolled back). However, tRFCs do not guarantee that LUWs will be executed in the sequence defined in the application. The qRFC variant overcomes this limitation by serializing tRFCs using queues, so that a LUW is only transferred once all of its predecessors in the queue have been processed.
Monitoring tRFCs and qRFCs is crucial for ensuring that your SAP systems are able to successfully communicate with each other, but these calls can fail for a number of reasons. For instance, you may see a spike in tRFC and qRFC errors if the target server cannot be reached or if the RFC server group does not have enough servers to accommodate incoming requests. qRFC errors are particularly important to keep an eye on because subsequent calls on an impacted queue cannot be processed until the error with the current call is resolved. Datadog allows you to set up monitors that will automatically notify you when these errors crop up, so you can immediately investigate them before they affect your customers.
Troubleshoot increased dialog response time
Another important metric to track is dialog response time, which is the amount of time it takes for a user request in the frontend to be processed in the backend and then sent back to the frontend—see SAP’s documentation for a more specific breakdown of this measurement. You can correlate an increase in dialog response time with the number of work processes, as well as resource metrics like CPU and memory usage, to verify whether the system is overloaded. If it is, you might want to optimize long-running processes, add indexes to your database to improve its performance, or scale up your system’s resources.

Get started in the Datadog Marketplace
Agentil’s SAP NetWeaver integration helps you monitor your SAP NetWeaver systems to ensure that they’re able to optimally support your business-critical services. The integration is now available in the Datadog Marketplace. If you’re not yet a Datadog customer, you can learn more about the Datadog Marketplace in our blog post—and sign up for a 14-day free trial. You can also take Agentil’s integration for a free test drive to see if it’s right for you.
The ability to promote branded monitoring tools in the Datadog Marketplace is one of the benefits of membership in the Datadog Partner Network. If you’re interested in developing an integration or application for the Datadog Marketplace, contact us at marketplace@datadog.com.
