


Jordan Obey
Ruby is an object-oriented programming language celebrated for its simple and easy-to-read syntax. It powers Ruby on Rails, the open source web development framework that streamlines common development tasks involved in building web applications. We’re pleased to announce that our Continuous Profiler, which provides low-overhead, code-level performance insights, is now generally available for Ruby applications. Continuous Profiler is always-on in production, so you can view how your Ruby code holds up under real-world conditions and identify which segments of your codebase can be optimized.
In this post, we’ll look at how Datadog Continuous Profiler enables you to easily view the resource usage of individual Ruby methods, correlate profiles and distributed traces, and compare profiles across versions, environments, and any other dimension you’re tracking in Datadog.
Quickly spot resource bottlenecks in your Ruby applications
As Ruby applications grow in size and complexity, identifying bottlenecks becomes more challenging. For instance, you may have hundreds of Rails routes mapped to controller actions and it may not be immediately clear which—if any—are consuming resources excessively. Continuous Profiler automatically collects representative stack traces and visualizes them in a flame graph, where each frame’s width corresponds to its resource usage. It also highlights the resource consumption of individual methods, libraries, and threads in a descending list, so you can isolate areas in need of optimization. For example, you may identify a Ruby method that is overconsuming CPU, which could indicate that it is executing more Active Record queries than you anticipated. To resolve this problem, you may consider implementing eager loading logic into your methods.
Datadog also provides a breakdown of resource consumption by endpoints (which are known as routes in Rails) so you can analyze how your application performs throughout different user journeys. For example, if you are investigating elevated CPU usage on an e-commerce application, you can use the endpoint list to see which workflow might be behind the issue. In the screenshot below, we can see significant CPU usage in the ProductsController#index endpoint.

Correlate profiles and distributed traces
Continuous Profiler is tightly integrated with Datadog APM, which includes end-to-end distributed tracing across your entire stack. This means that if you’re investigating the traces of your Ruby application and you see requests with errors or high latency, you can dive into “Code Hotspots” and related profiles to uncover potential bottlenecks. The screenshot below, for instance, shows a 500 error on a request to the checkout endpoint of an e-commerce application. The “Code Hotspots” tab reveals that the initialize method took over a second to execute, which could point to an issue with the logic you’re using to instantiate a new checkout item.

Similarly, if a profile reveals an endpoint with excessive resource consumption, as was the case in the ProductsController#index endpoint in the previous section, you can pivot to APM to see which service or services are impacted.
Compare profiles to verify performance improvements
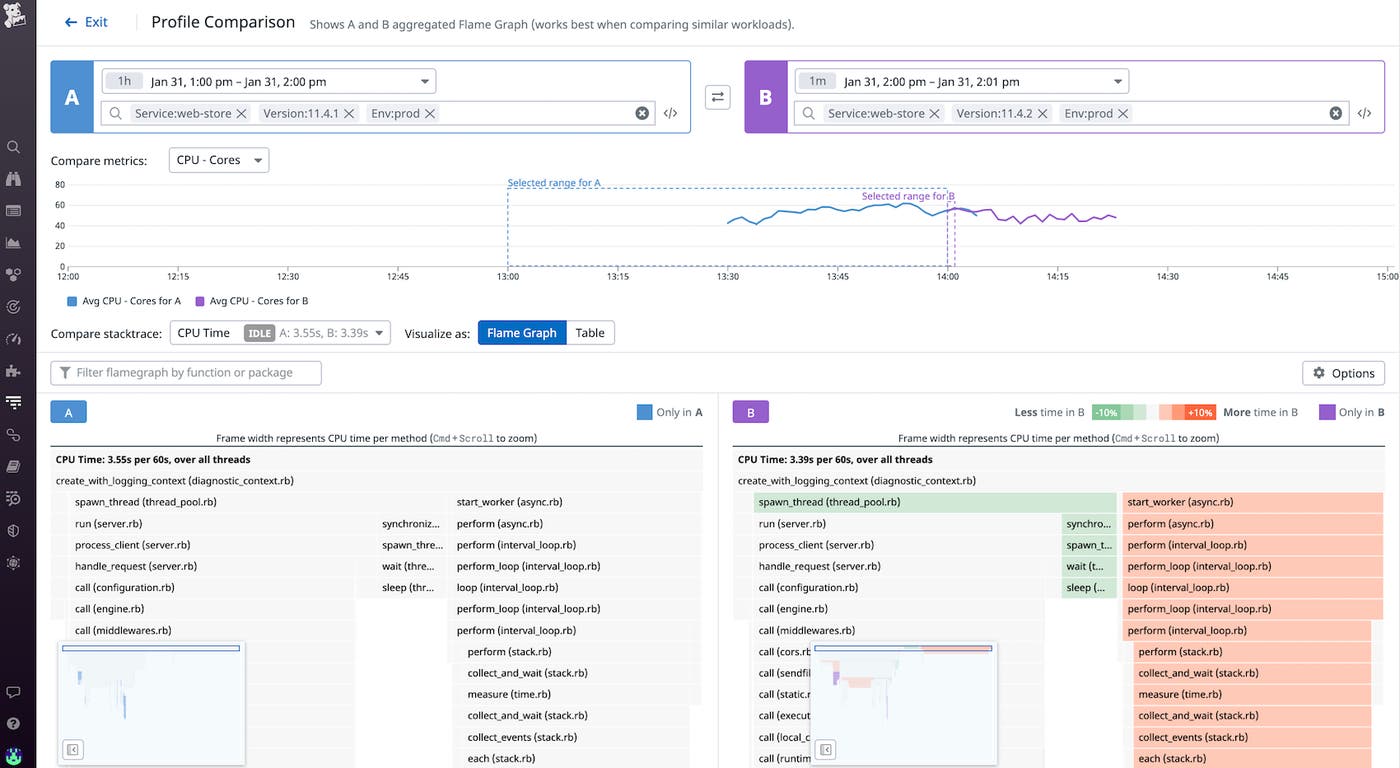
Once you’ve refactored your code to address a performance issue, it can be difficult to assess whether your changes have successfully reduced resource consumption—especially if you lack visibility into how your code has performed historically. Continuous Profiler integrates with Datadog Deployment Tracking, so you can compare profiles from previous versions of your codebase side-by-side with current profiles in order to verify that your updates were successful. Comparing profiles from different versions of your application is particularly useful when you’re deploying a canary release because it helps you confirm the efficacy of your changes before you deploy them widely.
In addition to comparing profiles from different versions of your application, you can also compare profiles that have different sets of Datadog tags. This capability allows you to compare performance, for example, between your staging and production environments, so you can identify and investigate any unexpected discrepancies.
Get started with Ruby profiling today
Datadog Continuous Profiler provides deep visibility into your codebase’s performance in production and is now generally available for Ruby, as well as Java, Python, and Go, with support for Node.js, .NET, and PHP on the way.
If you’re not already a Datadog customer, sign up for a 14-day free trial.


