K.Z. Win
Editor’s note: Redis and PostgreSQL use the terms “master” and “slave” to describe their architectures and certain metric names. Datadog does not use these terms. Within this blog post, we will refer to these terms as “primary” and “replica” for Redis and “primary” and “standby” for PostgreSQL.
K.Z Win is a DevOps Engineer at Peloton Cycle
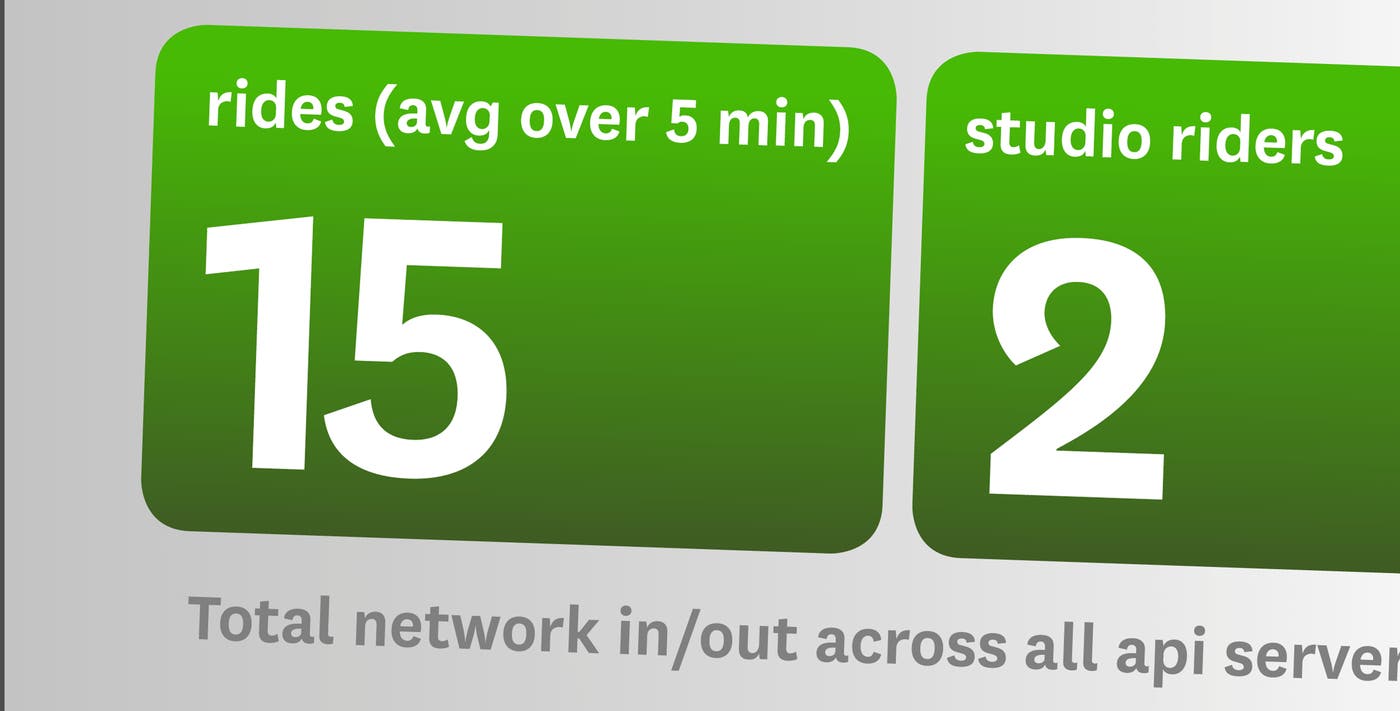
We use Datadog at Peloton Cycle to collect our server and application metrics. These metrics are used to monitor our system health, send alerts when certain thresholds are crossed as well as to inform the entire company about important business indicators.
Business metrics at Peloton Cycle
Peloton Cycle sells high-end indoor bicycles each of which comes with a 22” Android tablet. This tablet not only serves as a 1080p video screen for consuming live coaching sessions from our flagship studio in NYC but it also sends the rider’s performance data via http protocol to one of our many application servers which are running behind the reverse-proxied NGINX.
Out-of-the-box, Datadog has integrations for all of the software used in our infrastructure. We find the NGINX integration easy to set up and use. When customers are riding at home, the number of NGINX requests per second is dominated by their performance data stream. Datadog allows simple transformations of any raw metric to be output to a time-series graph or a query box as seen in the graph below.
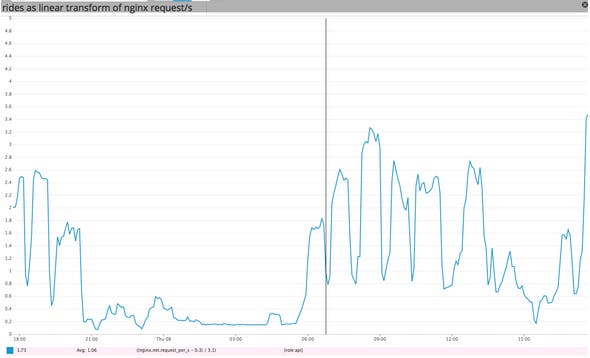
We can get an estimate of the number of live rides by using a linear transformation of NGINX requests/s:
live rides = (nginx requests/s – background requests/s)/3.1
3.1 is the typical rate that a rider is sending requests to NGINX. Here “background requests/s” represents the requests to other applications servers; normally this number is roughly constant. While this formula served our needs for a few months, we wanted a more accurate way to extract this business metric. One problem with this metric is that the real background metric includes metrics that have nothing to do with a ride and that are subject to change. For instance, if we get a lot of traffic on our website, http requests to other app servers effects the ride count. In addition, an atypical usage pattern during the ride can cause the denominator to deviate somewhat from 3.1.
A more accurate way: monitor riders with DogStatsD
Datadog comes with a plug-in framework to monitor log files. It takes care of tailing the file and feeds the log lines almost as they come in to your own log parser written as a Python module. We have been using this system to monitor NGINX access logs because we want to know which endpoints of our API server are particularly slow. We set up alerts so our log parser reports slow endpoints in our Datadog Events Stream as seen below.
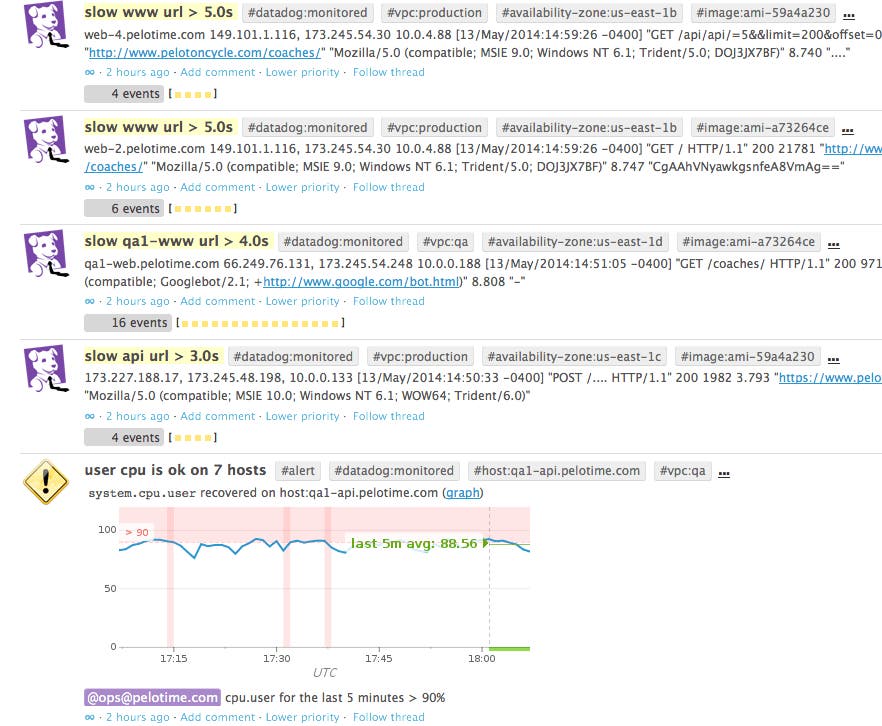
While this served our needs initially, as the number of requests to our API grew, the number of such events began to flood our Events Stream. We also felt that it was wasteful to throw away the structured data from the log parser for most of the requests since slow URLs made up only a small fraction of the total.
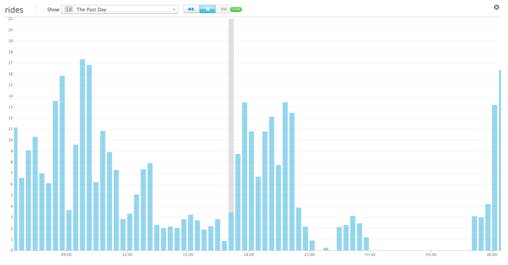
With a little additional effort, we rewrote our log parser to send all NGINX requests data to a local DogStatsD server. This UDP server comes with any machine running the Datadog agent and takes care of periodically flushing accumulated data to the metric server. Essentially we now use web counters as described in the Sending Metrics with DogStatsD guide and tag each hit with a normalized URL. Now that this counter metric is set up we can treat the data as equivalent to NGINX request/s and we can more accurately count the number of rides by keeping track of requests/s for one specific endpoint. If no rides are happening this metric is appropriately missing instead of reporting 0.1 or 0.3 as in our previous case. The timeseries graph below shows the number of live rides over a 24-hours period.
Implement custom checks for replica or standby monitoring
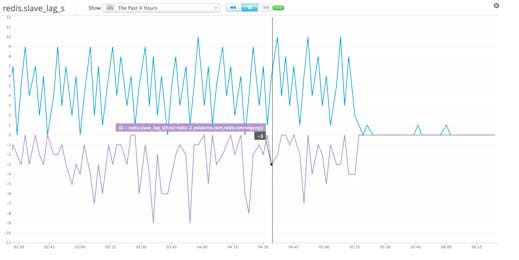
At Peloton Cycle we use Redis and PostgreSQL databases. Datadog monitors useful Redis and PostgreSQL metrics but does not have the ability to monitor the health of the cluster where one has replica or standby instances spread out over multiple machines. We maintain read-only standbys of our databases as hot-standby backups and we need the ability to keep track of how far a replica or standby is behind the primary in time. We implement these by extending AgentCheck python class as described in the Writing an Agent Check guide. Inside a custom check, we send replica and standby lags by calling self.gauge(METRIC, lag_time, tags=useful_tags). If there is any error in parsing the lag time, it sends an event to our Datadog Events Stream. We have also created Datadog alerts on these replica and standby metrics to warn us if they cross specific thresholds.
Conclusion
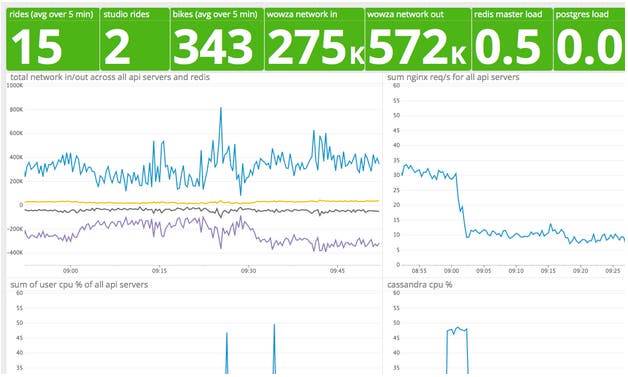
We have found that Datadog is a developer-friendly metric collecting service. Many software integrations that come with Datadog serves many of our needs and its open source framework allows easy customization and extension. We especially like using the Datadog ScreenBoards as a tool for conveying system and business metrics to a company-wide audience.
Try a free 14 day Datadog trial and create your own custom IT and business metrics to monitor your system health, send alerts and inform your company about important business measurements.
