Nicholas Thomson

Casey Culligan

Nenad Noveljic
Datadog Database Monitoring (DBM), which provides host-level and query performance metrics and insights for PostgreSQL, MySQL, and SQL Server, is now available for Oracle. Oracle is one of the most common database types, and now teams that operate Oracle databases can use Datadog to monitor these resources alongside telemetry from across their environments.
DBM supports self-managed, RDS, RAC, Exadata, Autonomous Database, and Automatic Storage Management deployment configurations, so teams that utilize several types of Oracle databases can monitor their performance in Datadog.
In this post, we’ll show how you can use Database Monitoring to monitor the health and performance of your Oracle databases by:
- Exploring the Databases view
- Using normalized queries to investigate incidents
- Understanding resource utilization with Query Samples
- Facilitating cross-team collaboration with the out-of-the-box dashboard
Explore the Databases view
Once you’ve set up DBM for Oracle, you can navigate to the Databases view in Datadog to see vital metrics such as queries per second and alerts for each of your monitored databases.
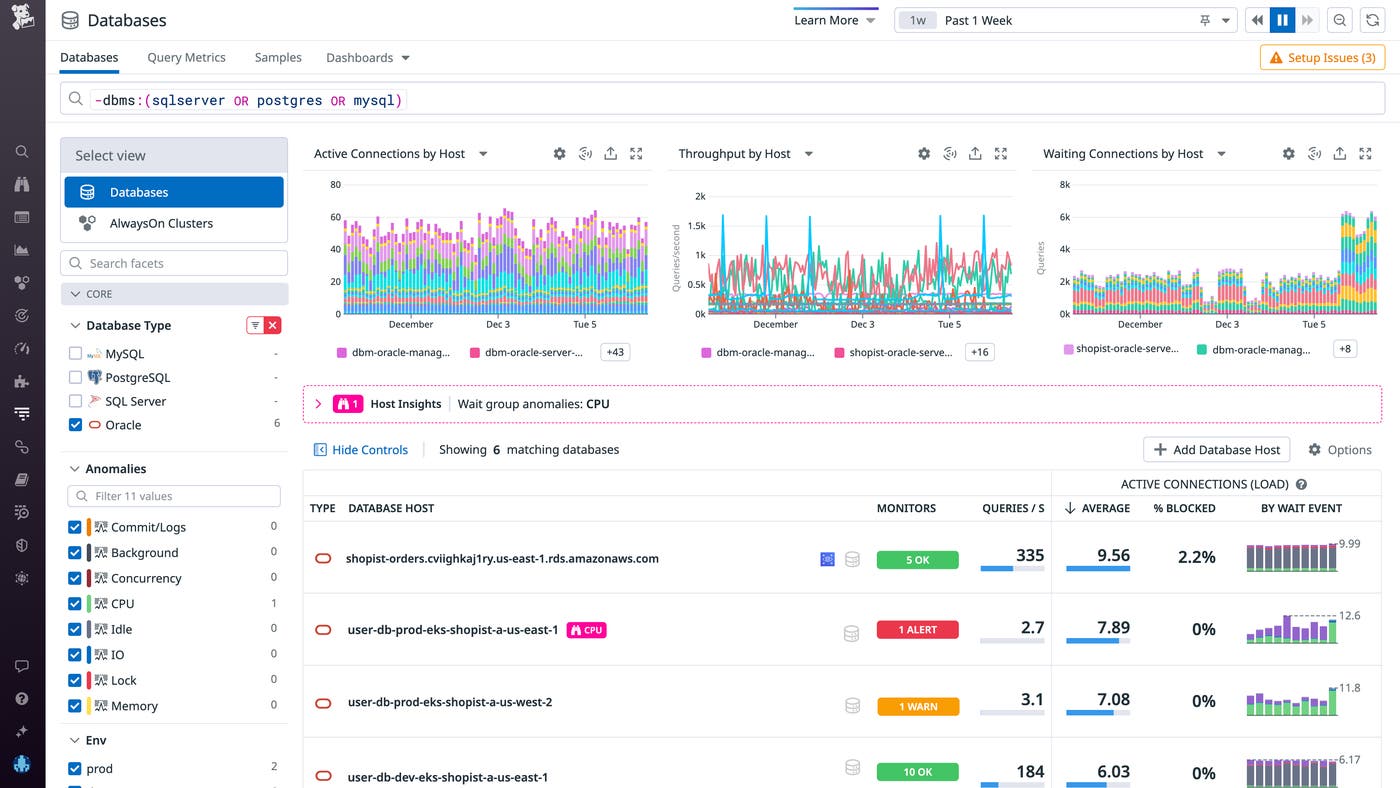
For each host, we capture active connections—the queries that are running on your host—both historically and in near-real time, helping you understand the load that your databases experience and which queries contribute the most to that load.
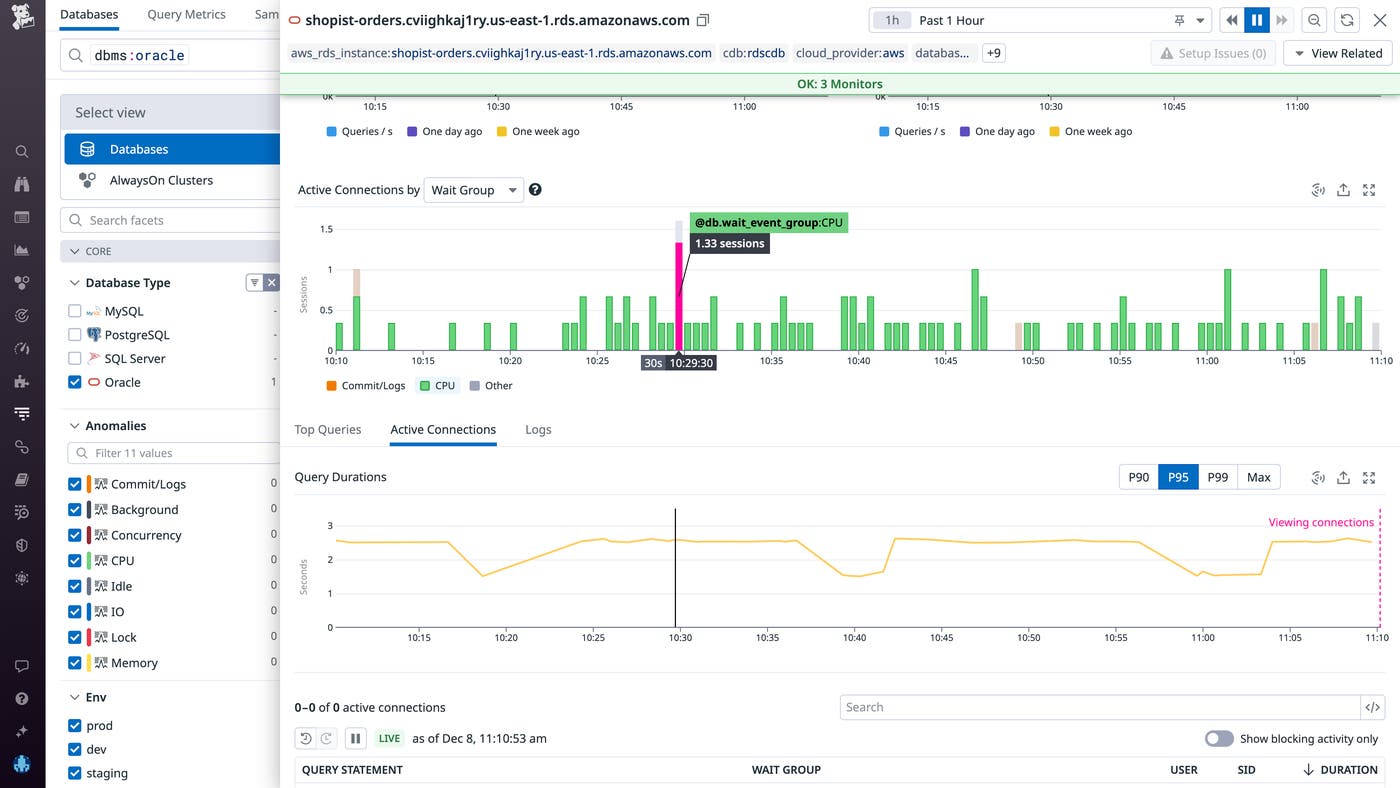
Clicking on a database host will bring up the host details side panel, where you can see a breakdown of top queries and active connections running on this particular database. The timeseries at the top of the page allows you to view your active connections by wait group, which shows you what resources your queries are waiting for. In the example below, you can see the queries are mostly running on CPU.
Use normalized queries to investigate incidents
Problematic queries can waste valuable resources and block other queries from running, which in turn creates downstream issues, such as application errors that degrade the end-user experience and increased latency that makes it harder for data analysts to engage with your databases. It’s important to monitor your queries so you can identify and optimize inefficient ones in order to ensure your application runs smoothly.
DBM provides visibility into Query Metrics for normalized queries—templates of common queries that share a replicable structure in which literal values, such as names, passwords, and dates, are obfuscated. Below, you can see the breakdown of wait groups per normalized query statement. The Top Queries view shows aggregate stats for normalized queries (e.g., average duration, total duration, execution count, etc.).
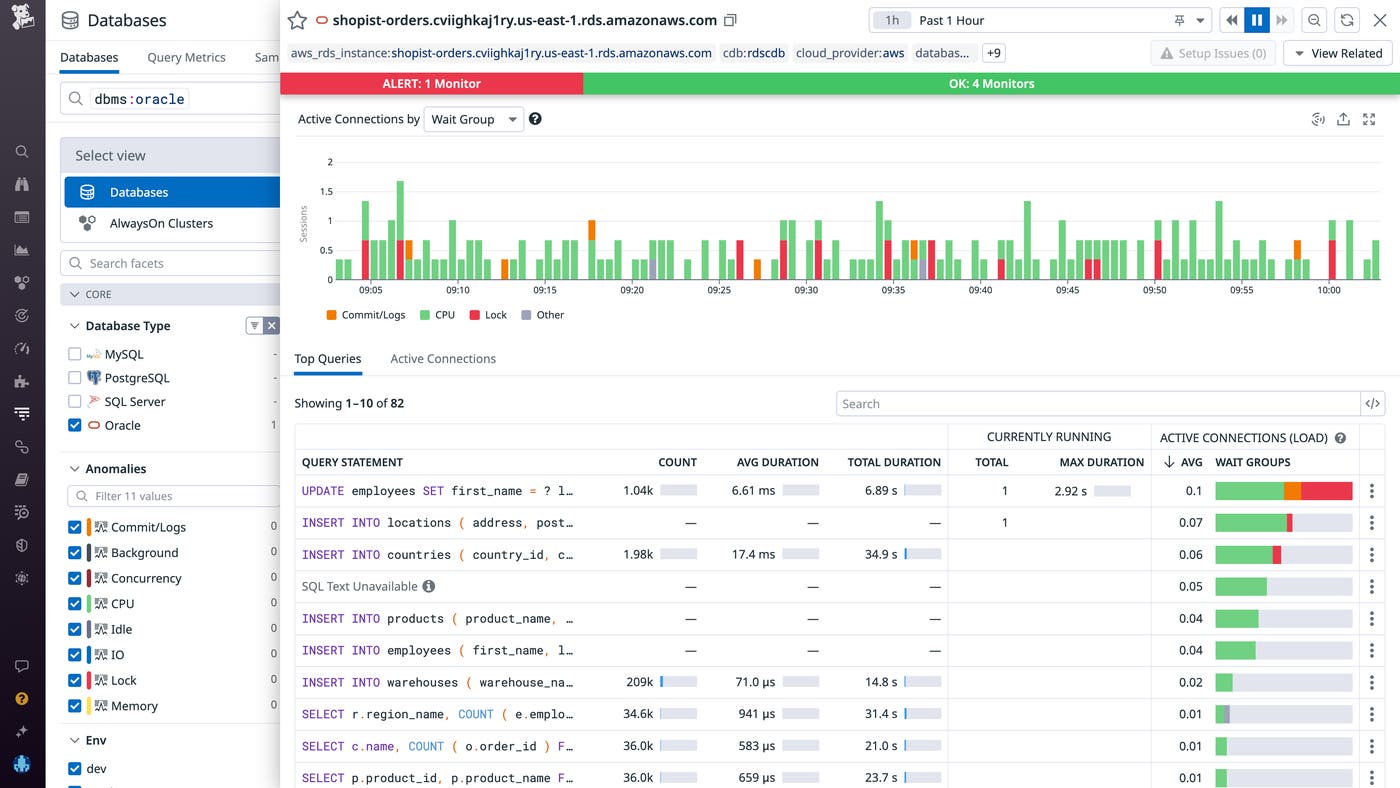
This gives you a sense of which types of queries running on this host are taking the longest time to run, which can be very useful for incident response. If you click on one, you will see the aggregate stats that we’ve collected per normalized query.
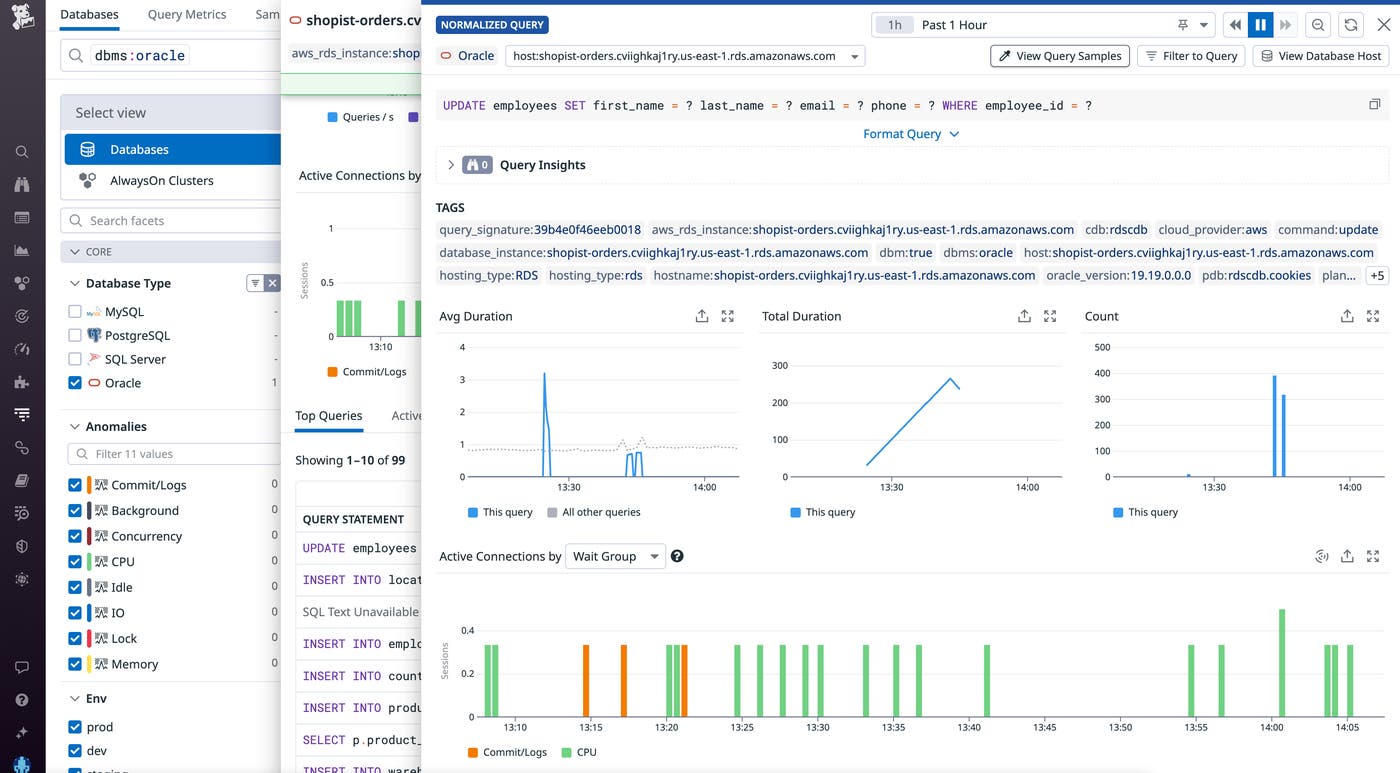
For example, say you’re an SRE at an e-commerce application that relies on Oracle databases, and you receive a page that user checkouts are timing out at an elevated rate. You navigate to DBM and select the database that hosts your inventory records and find that a large number of UPDATE statements are being delayed due to lack of CPU availability. With this knowledge in hand, you scale up your resources to ensure that your database operations can run efficiently.
Normalized queries also include explain plans, which use a node tree to illustrate the execution of a query. Each node in the tree represents a single operation such as a sort, join, or aggregation. Explain plans can help you see which steps of an expensive query might benefit from optimization. You can compare the total cost of each operation in the explain plan, as shown in the screenshot below.
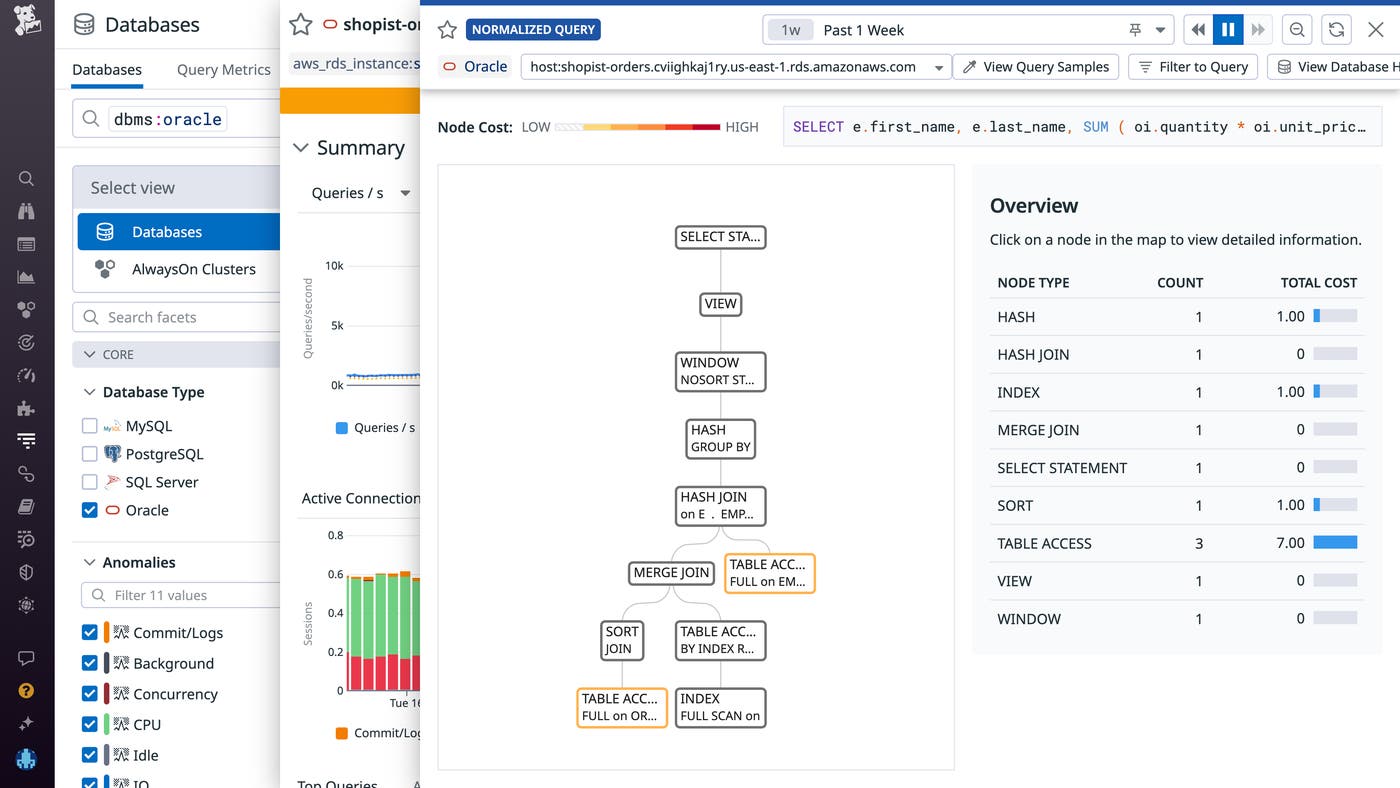
With this type of visualization, you can quickly pinpoint where your optimization efforts will go the furthest and ensure the steps you take to optimize your queries result in cost savings and increased application efficiency.
Understand resource utilization with Query Samples
While normalized queries give you a high-level view into your system, Query Samples provide more granular insights into database performance, such as information about a specific execution (e.g., what database user is running it, or the client IP address). Query Samples taken from your databases allow you to see where the query was executed (i.e., on which host or application), along with other details such as its duration and wait group. You can view these in near-real time or at a specific point in time, which is useful for incident response and postmortems. View Query Samples button at the top will bring up a list of sampled queries.

Because these sample queries have tagged metadata, you can easily search, filter, and visualize queries. For example, you can group your most resource-intensive queries (e.g., those that require the most CPU) by application in order to determine which ones you should optimize first.
Facilitate cross-team collaboration with the out-of-the-box dashboard
DBM comes with an out-of-the-box dashboard, which provides an overview of host health metrics, like CPU utilization, memory usage, and I/O.
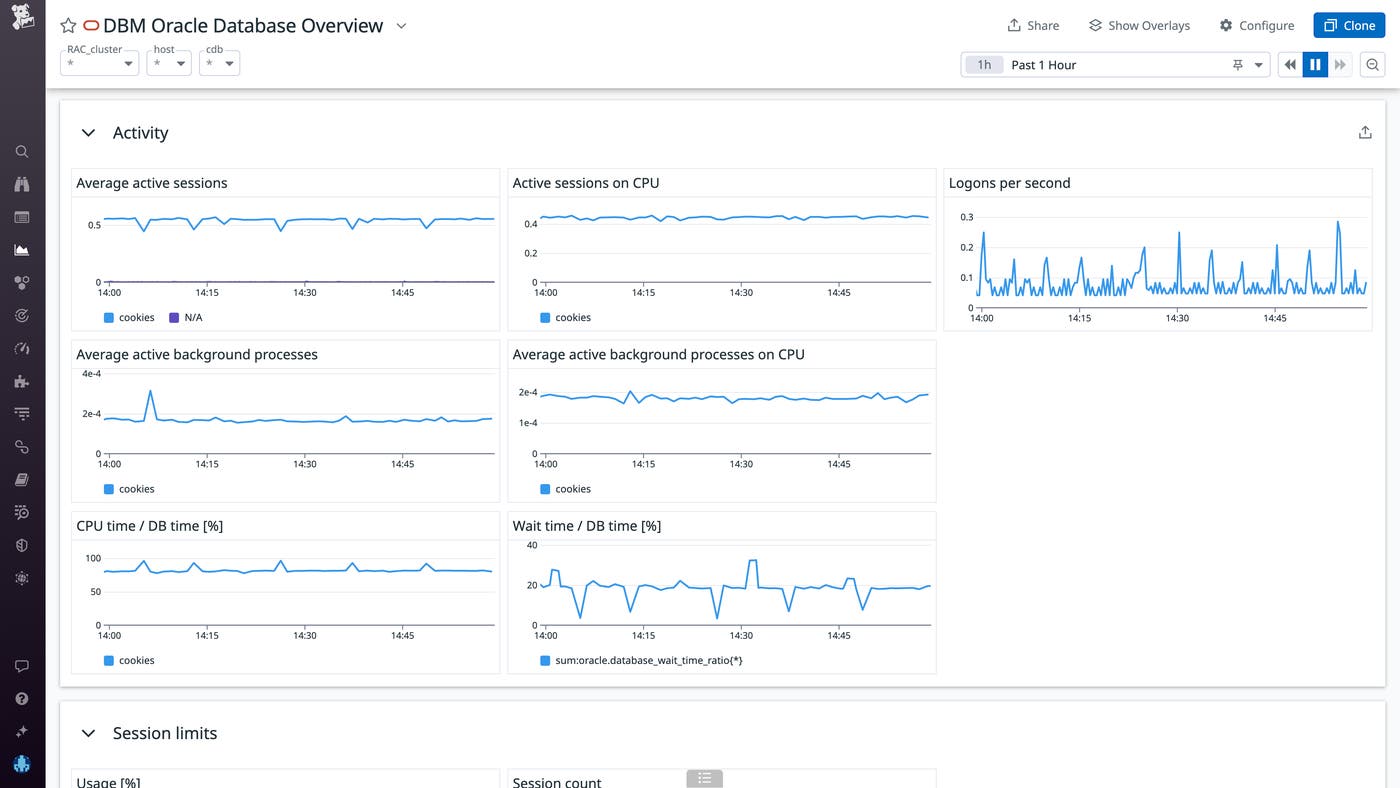
This dashboard makes it easy for anyone on your team to gain a high-level view of the important metrics that Datadog is collecting from your Oracle databases. This can be very useful during incidents because a central, shared view of health metrics can facilitate cross-team collaboration and help you expedite resolution.
To continue our example from above, if you receive a page about failing user transactions on the e-commerce application you manage, a good first step would be to check the Oracle dashboard to see if there are any indicators from your database’s overall health. In this case, you would see a spike in CPU time. Because the timeseries are broken out by host, you can easily find which host is the source of the problematic rise in CPU time. From here, you can pivot to Query Metrics or Samples to figure out the root cause of the spike as quickly as possible. You can also set a monitor on CPU time to alert you whenever it rises above a certain threshold, so you can quickly address the spike if it happens again.
Gain visibility into your Oracle databases with Datadog DBM
Datadog DBM now enables teams running applications that rely on Oracle databases to monitor their queries and vital health metrics from their database hosts. This increased visibility helps teams understand what resources queries are waiting on, identify high-cost explain plan nodes that can benefit from optimization, facilitate cross-team collaboration with our out-of-the-box dashboard, and more.
To get started gaining deeper visibility into your Oracle databases, set up DBM for Oracle on your hosts today.
If you’re new to Datadog, sign up for a 14-day free trial.
