Jordan Obey
NS1 is an intelligent DNS and traffic management platform that helps optimize the performance of your network infrastructure and speed application delivery to your end users. Since even a small increase in service latency can lead to churn and revenue loss, it’s critical to remove any inefficiencies embedded in basic network functions. NS1 helps ensure high performance for name resolution and routing through support for the edns0-client-subnet (ECS) DNS extension and for Filter Chain technology. Together, these technologies help minimize application latency over your existing infrastructure and provide customers with a high quality of experience.
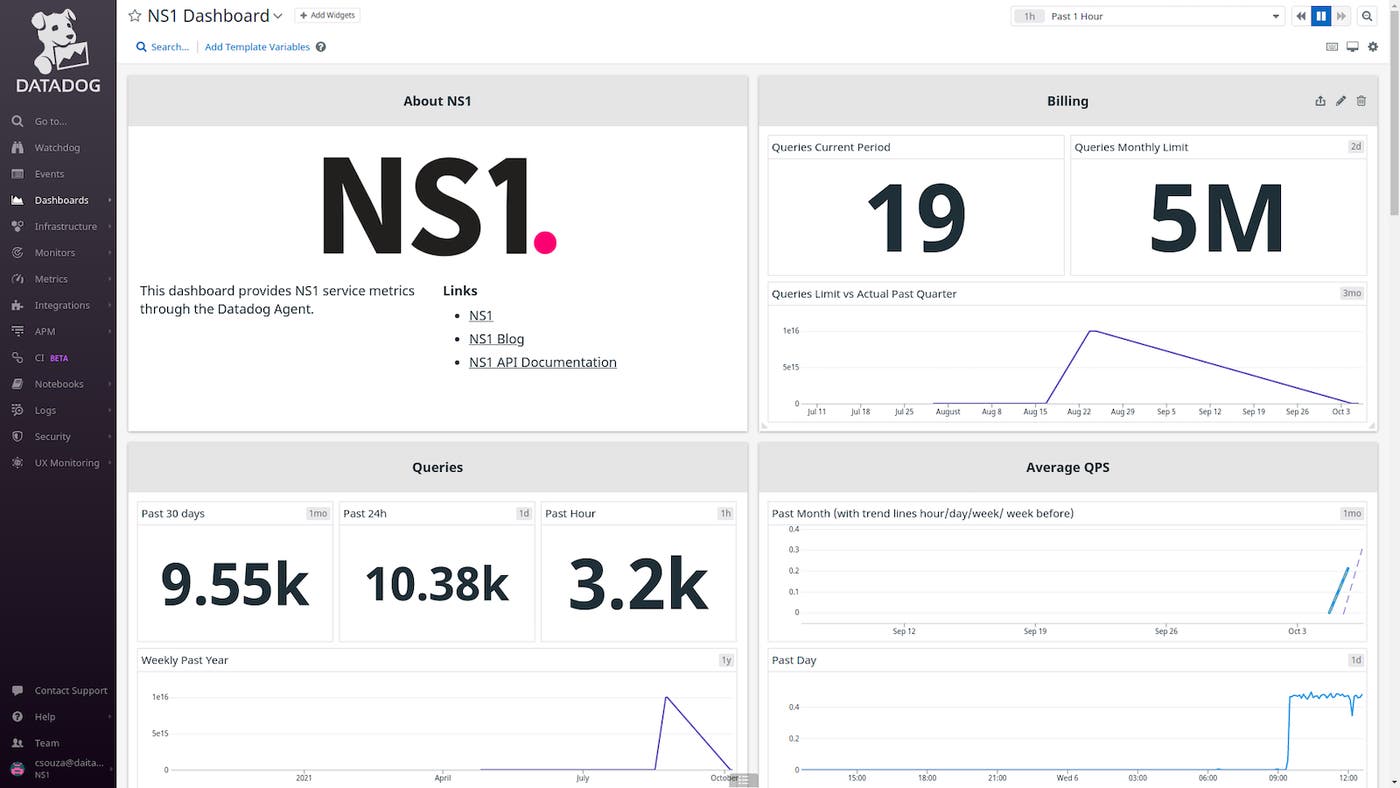
Datadog’s NS1 integration collects key NS1 performance and usage metrics, such as query rates and lease counts, and visualizes them in an out-of-the-box dashboard. Now you can monitor your NS1 data alongside telemetry from the rest of your application infrastructure, enabling a top-to-bottom, end-to-end view of your services on a single, unified platform.

Track query rates across NS1 accounts, records, and zones
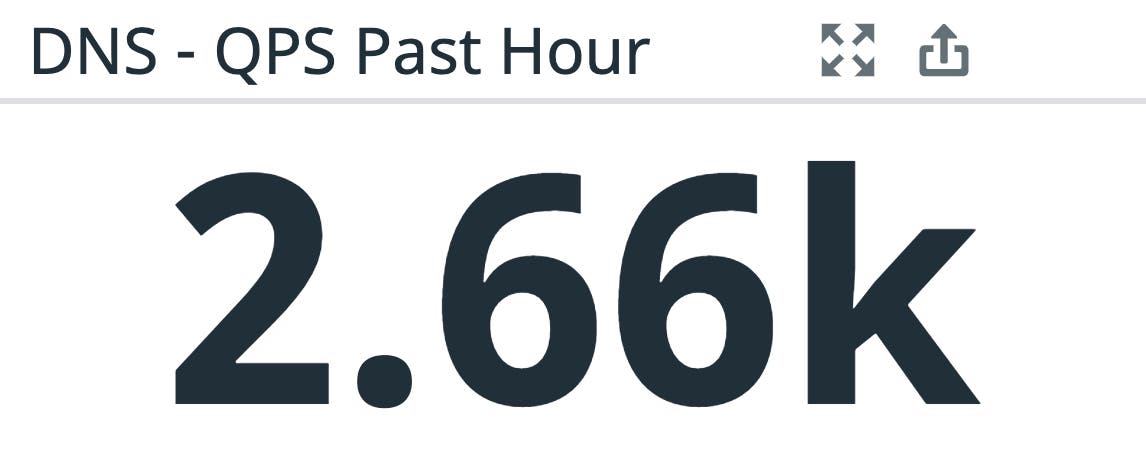
In DNS, data is divided into zones, which describe portions of the domain name space that organizations are responsible for managing, and records, which contain mappings of domain names to IP addresses. NS1 emits metrics that track the average number of queries per second (QPS) received at both the zone (ns1.qps.zone) and record level (ns1.qps.record), as well as the total QPS received by applications and services associated with your NS1 account (ns1.qps.account). This range of scopes enables you to adjust your view as needed. For example, let’s say an alert has notified you that overall QPS has unexpectedly passed a specific threshold. You can then dive deeper into the QPS of zones and records to determine where it might be necessary to scale up your infrastructure or tweak the time-to-live (TTL) configuration of your DNS records.

You can also draw upon Datadog’s machine learning (ML) features to improve DNS visibility and help prevent performance issues. For example, with Datdog’s forecasting feature, you can predict if query volume is about to surpass infrastructure capacity limits. Anomaly detection, establishes baseline query volume patterns and alerts on any abnormal drops or spikes that could indicate potential issues (such as connection loss or an attempted DNS amplification attack).
Monitor Pulsar performance and availability
Pulsar is NS1’s intelligent routing engine. Pulsar helps enhance application delivery by monitoring user activity and then using that telemetry to identify the best-performing endpoints and connecting users to them. Because of Pulsar’s central role in helping to optimize routing and application delivery, it’s important to monitor the performance and availability of this routing engine.
Datadog provides you with visibility into Pulsar performance by collecting and visualizing associated metrics. These metrics include the number of routing decisions Pulsar has made in a specified window of time (ns1.pulsar.decisions) as well as how many decisions it has failed to make (ns1.pulsar.decisions.insufficient) due to insufficient user telemetry, configuration errors, or other problems. Comparing the number of successful decisions to failed decisions can help you quickly spot any Pulsar performance issues that require attention.

Datadog also collects Pulsar’s uptime percentage, which allows you to easily view and set alerts on its availability. And, because Datadog automatically tags uptime percentage by resource (indicating a specific CDN or public cloud network, for example), you can quickly spot outages and begin mitigations to help ensure that you meet SLAs.
Optimize DNS costs with NS1 usage metrics
Finally, to help you manage your NS1 account and get the most out of your subscription, Datadog collects NS1 usage and billing data. NS1 offers different plan types that each have a specified monthly DNS query limit which, if exceeded, can increase your organization’s NS1 costs. Datadog enables you to compare this query limit to the number of queries you have received in the current billing period. By viewing these values side by side, you’ll know at a glance if you’re close to exceeding the limit. You can also set a forecasting alert to notify you when Datadog predicts that the number of queries will exceed your monthly limit. This type of forecasting enables you to preemptively update your current plan to avoid incurring unnecessary costs.
Start monitoring NS1 today
Datadog has over 1,000 integrations, which means you can monitor NS1 DNS metrics alongside all the telemetry from the services and technologies across your organization. To get started and learn more about our NS1 integration, check out our documentation here. If you aren’t already using Datadog, sign up today for a 14-day free trial.


