Editor’s note: Gunicorn uses the term “master” to describe its primary process. Datadog does not use this term. Within this blog post, we will refer to this as “primary,” except for the sake of clarity in instances where we must reference a specific process name.
This post is part of a series on troubleshooting NGINX 502 Bad Gateway errors. If you’re not using Gunicorn, check out our other article on troubleshooting NGINX 502s with PHP-FPM as a backend.
Gunicorn is a popular application server for Python applications. It uses the Web Server Gateway Interface (WSGI), which defines how a web server communicates with and makes requests to a Python application. In production, Gunicorn is often deployed behind an NGINX web server. NGINX proxies web requests and passes them on to Gunicorn worker processes that execute the application.
NGINX will return a 502 Bad Gateway error if it can’t successfully proxy a request to Gunicorn or if Gunicorn fails to respond. In this post, we’ll examine some common causes of 502 errors in the NGINX/Gunicorn stack, and we’ll provide guidance on where you can find information you need to resolve these errors.
Explore the metrics, logs, and traces behind NGINX 502 Bad Gateway errors using Datadog.
Some possible causes of 502s
In this section, we’ll describe how the following conditions can cause NGINX to return a 502 error:
- Gunicorn is not running
- NGINX can’t communicate with Gunicorn
- Gunicorn is timing out
If NGINX is unable to communicate with Gunicorn for any of these reasons, it will respond with a 502 error, noting this in its access log (/var/log/nginx/access.log) as shown in this example:
access.log
127.0.0.1 - - [08/Jan/2020:18:13:50 +0000] "GET / HTTP/1.1" 502 157 "-" "curl/7.58.0"NGINX’s access log doesn’t explain the cause of a 502 error, but you can consult its error log (/var/log/nginx/error.log) to learn more. For example, here is a corresponding entry in the NGINX error log that shows that the cause of the 502 error is that the socket doesn’t exist, possibly because Gunicorn isn’t running. (In the next section, we’ll look at how to detect and correct this problem.)
error.log
2020/01/08 18:13:50 [crit] 1078#1078: *189 connect() to unix:/home/ubuntu/myproject/myproject.sock failed (2: No such file or directory) while connecting to upstream, client: 127.0.0.1, server: localhost, request: "GET / HTTP/1.1", upstream: "http://unix:/home/ubuntu/myproject/myproject.sock:/", host: "localhost"Gunicorn isn’t running
Note: This section includes a process name that uses the term “master.” Except when referring to specific processes, this article uses the term “primary” instead.
If Gunicorn isn’t running, NGINX will return a 502 error for any request meant to reach the Python application. If you’re seeing 502s, first check to confirm that Gunicorn is running. For example, on a Linux host, you can use a ps command like this one to look for running Gunicorn processes:
ps aux | grep gunicornOn a host where Gunicorn is serving a Flask app named myproject, the output of the above ps command would look like this:
ubuntu    3717  0.3  2.3  65104 23572 pts/0    S    15:45   0:00 gunicorn: master [myproject:app]
ubuntu    3720  0.0  2.0  78084 20576 pts/0    S    15:45   0:00 gunicorn: worker [myproject:app]
If the output of the ps command doesn’t show any Gunicorn primary or worker processes, see the documentation for guidance on starting your Gunicorn daemon.
In a production environment, you should consider using systemd to run your Python application as a service. This can make your app more reliable and scalable, since the Gunicorn daemon will automatically start serving your Python app when your server starts or when a new instance launches.
Once your Gunicorn project is configured as a service, you can use the following command to ensure that it starts automatically when your host comes up:
sudo systemctl enable myproject.serviceThen you can use the list-unit-files command to see information about your service:
sudo systemctl list-unit-files | grep myprojectOn a Linux server that has Gunicorn installed (even if it is not running), the output of this command will be:
myproject.service enabledTo see information about your Gunicorn service, use this command:
sudo systemctl is-active myprojectThis command should return an output of active. If it doesn’t, you can start the service with:
sudo service myproject startIf Gunicorn won’t start, it could be due to a typo in your unit file or your configuration file.
To find out why your application didn’t start, use the status command to see any errors that occurred on startup and use this information as a starting point for your troubleshooting:
sudo systemctl status myproject.serviceNGINX can’t access the socket
When Gunicorn starts, it creates one or more TCP or Unix sockets to communicate with the NGINX web server. Gunicorn uses these sockets to listen for requests from NGINX.
To determine whether a 502 error was caused by a socket misconfiguration, confirm that Gunicorn and NGINX are configured to use the same socket. By default, Gunicorn creates a TCP socket located at 127.0.0.1:8000. You can override this default by using Gunicorn’s --bind switch to designate a different location—a different TCP socket, a Unix socket, or a file descriptor. The command shown here starts Gunicorn on the localhost using port 4999. (Flask apps typically run on port 5000, but that’s also the port used by the Datadog Agent by default, so we’ll adjust our examples to avoid any conflict.)
gunicorn --bind 127.0.0.1:4999 myproject:appIf your Gunicorn project is running as a systemd service, its unit file (e.g., /etc/systemd/system/myproject.service) will contain an ExecStart line where you can specify the bind information, similar to the command above. This is shown in the example unit file below:
myproject.service
[Unit]
Description=My Gunicorn project description
After=network.target

[Service]
User=ubuntu
Group=nginx
WorkingDirectory=/home/ubuntu/myproject
ExecStart=/usr/bin/gunicorn --bind 127.0.0.1:4999 myproject:app

[Install]
WantedBy=multi-user.target
Alternatively, your bind value can be in a Gunicorn configuration file. See the Gunicorn documentation for more information.
Next, check your nginx.conf file to ensure that the relevant location block specifies the same socket information Gunicorn is using. The example below contains an include directive that prompts NGINX to include proxy information in the headers of its requests, and a proxy_pass directive that specifies the same TCP socket named in the Gunicorn --bind options shown above.
nginx.conf
location / {
  include proxy_params;
  proxy_pass http://127.0.0.1:4999;
}
If Gunicorn is listening on a Unix socket, the proxy_pass option will have a value in the form of /path/to/socket.sock, as shown below:
www.conf
proxy_pass unix:/home/ubuntu/myproject/myproject.sock;Just as with a TCP socket, you can prevent 502 errors by confirming that the path to this socket matches the one specified in the NGINX configuration.
Unix sockets are subject to Unix file system permissions. If you’re using a Unix socket, make sure its permissions allow read and write access by the group running NGINX. (You can use Gunicorn’s umask flag to designate the socket’s permissions.) If the permissions on the socket are incorrect, NGINX will log a 502 error in its access log, and a message like the one shown below in its error log:
error.log
2020/03/02 20:31:26 [crit] 18749#18749: *8551 connect() to unix:/home/ubuntu/myproject/myproject.sock failed (13: Permission denied) while connecting to upstream, client: 127.0.0.1, server: localhost, request: "GET / HTTP/1.1", upstream: "http://unix:/home/ubuntu/myproject/myproject.sock:/", host: "localhost"Gunicorn is timing out
If your application is taking too long to respond, your users will experience a timeout error. Gunicorn’s timeout defaults to 30 seconds, and you can override this in the configuration file, on the command line, or in the systemd unit file. If Gunicorn’s timeout is less than NGINX’s timeout (which defaults to 60 seconds), NGINX will respond with a 502 error. The NGINX error log shown below indicates that the upstream process—which is Gunicorn—closed the connection before sending a valid response. In other words, this is the error log we see when Gunicorn times out:
error.log
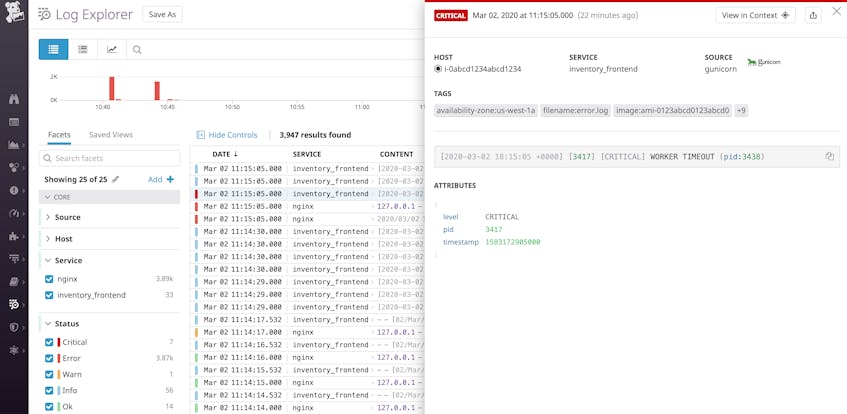
2020/03/02 20:38:51 [error] 30533#30533: *17 upstream prematurely closed connection while reading response header from upstream, client: 127.0.0.1, server: localhost, request: "GET / HTTP/1.1", upstream: "http://127.0.0.1:4999/", host: "localhost"Your Gunicorn log may also have a corresponding entry. (Gunicorn logs to stdout by default; see the documentation for information on configuring Gunicorn to log to a file.) The log line below is an example from a Gunicorn log, indicating that the application took too long to respond, and Gunicorn killed the worker thread:
[2020-03-02 18:15:05 +0000] [3417] [CRITICAL] WORKER TIMEOUT (pid:3438)You can increase Gunicorn’s timeout value by adding the --timeout flag to the Gunicorn command you use to start your application—whether it’s in an ExecStart directive in your unit file, in a startup script, or using the command line as shown below:
gunicorn --timeout 60 myproject:appRaising Gunicorn’s timeout could cause another issue: NGINX may time out before receiving a response from Gunicorn. The default NGINX timeout is 60 seconds; if you’ve raised your Gunicorn timeout above 60 seconds, NGINX will return a 504 Gateway Timeout error if Gunicorn hasn’t responded in time. You can prevent this by also raising your NGINX timeout. In the example below, we’ve raised the timeout value to 90 seconds by adding the fastcgi_read_timeout item to the http block in /etc/nginx/nginx.conf:
nginx.conf
http {
...
    fastcgi_buffers 8 16k;
    fastcgi_buffer_size 32k;
    fastcgi_connect_timeout 90s;
    fastcgi_send_timeout 90s;
    fastcgi_read_timeout 90s;
    proxy_read_timeout 90s;
}
Reload your NGINX configuration to apply this change:
sudo nginx -s reloadNext, to determine why Gunicorn timed out, you can collect logs and application performance monitoring (APM) data that can reveal causes of latency within and outside your application.
Collect and analyze your logs
To troubleshoot 502 errors, you can collect your logs with a log management service. NGINX logging is active by default, and you can customize the location, format, and logging level.
By default, Gunicorn logs informational messages about server activity, including startup, shutdown, and the status of Gunicorn’s worker processes. You can add custom logging to your Python application code to collect logs corresponding to any notable events you want to track. This way, when you see a 502 error in NGINX’s access log, you can also reference the NGINX error log and your Python application logs. You can get even greater visibility by collecting logs from relevant technologies like caching servers and databases to correlate with any NGINX 502 error logs. Aggregating these logs in a single platform gives you visibility into your entire web stack, shortening your time spent troubleshooting and reducing your MTTR.
Collect APM data from your web stack
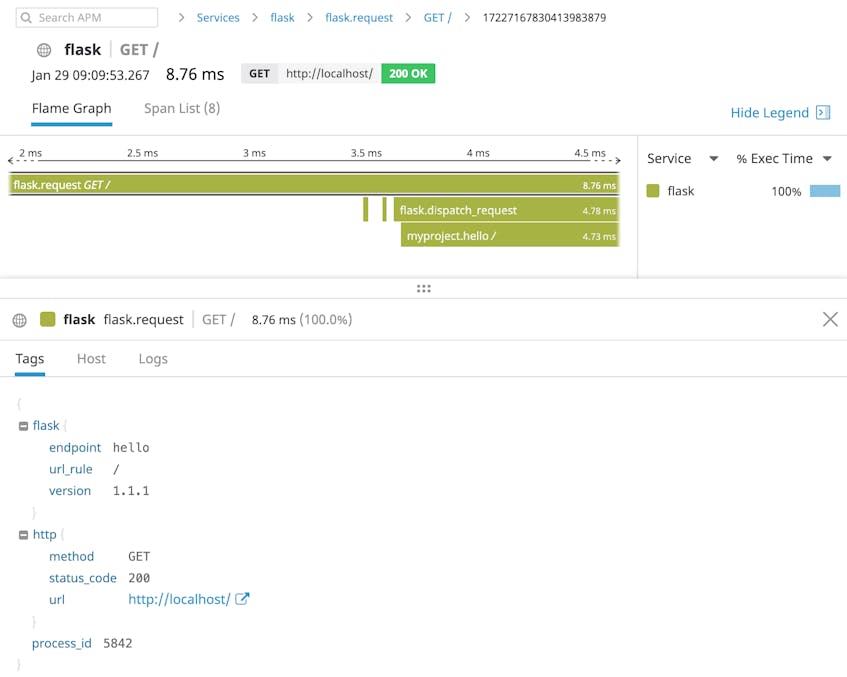
APM can help you identify bottlenecks and resolve issues—like 502 errors—that affect the performance of your app. The screenshot below shows a flame graph—a timeline of calls to all the services required to fulfill a request. Service calls are shown as horizontal spans, which illustrate the sequence of calls and the duration of each one.
Additionally, APM visualizations in Datadog show you your app’s error rates, request volume, and latency, giving you valuable context as you investigate performance problems like 502 errors.
Datadog’s Python tracing supports numerous Python frameworks, so it’s easy to start tracing your applications without making any changes to your code. See the Datadog docs for information on collecting APM data from your Python applications.
200 OK
The faster you can diagnose and resolve your application’s 502 errors, the better. Datadog allows you to analyze metrics, traces, logs, and network performance data from across your infrastructure. If you’re already a Datadog customer, you can start monitoring NGINX, Gunicorn, and more than 700 other technologies. If you don’t yet have a Datadog account, sign up for a 14-day free trial and get started in minutes.


