

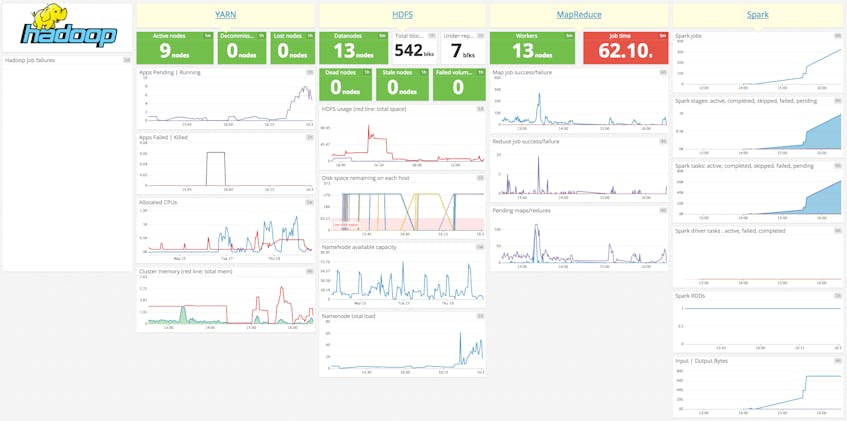
Using Datadog you can now immediately start monitoring the four most widely-used technologies in the Hadoop ecosystem: HDFS, MapReduce, YARN, and Spark.
Apache Hadoop began as an open source implementation of Google’s MapReduce algorithm and its supporting infrastructure. Over time Hadoop evolved to accommodate different execution engines in addition to MapReduce, such as Spark. Today Hadoop is the standard data processing platform for large data sets, and is used by very nearly all companies with large amounts of data.
Hadoop is great, but sometimes opaque
Hadoop is incredibly widely used because it does a good job solving an important and complex problem: distributed data processing. But it is a complex technology, and it can be quite difficult to know what’s happening, why jobs fail, if issues in Hadoop are related to the data, upstream / downstream issues in other parts of your stack, or Hadoop itself. As with most distributed systems running on many machines, it can be quite hard to collaboratively solve problems.
Datadog + Hadoop
So we decided to add the power of Datadog to Hadoop. After you turn on the integration, you can see hundreds of Hadoop metrics alongside your hosts’ system-level metrics, and can correlate what’s happening in Hadoop with what’s happening throughout your stack. You can set alerts when critical jobs don’t finish on time, on outliers or on pretty much any problematic Hadoop scenario of which you want to be made aware.
HDFS
Using the HDFS integration you can monitor:
- the number of data nodes: live, dead, stale, decommissioning
- number of blocks: under-replicated, pending replication, pending deletion
- disk space remaining on each host, and on the cluster as a whole
- namenode load and lock queue length
- and more
MapReduce
The MapReduce integration includes metrics for:
- map and reduce jobs pending, succeeded, and failed
- map and reduce input / output records
- bytes read by job or in total
- any counter
- and more
YARN
The YARN integration gives visibility to:
- nodes: active, lost, unhealthy, rebooted, total
- apps: submitted, pending, running, completed, failed, killed
- cluster cores: allocated, available, reserved, total
- cluster memory: in use, total available
- and more
Spark
With the Spark integration you can see:
- driver and executor: RDD blocks, memory used, disk used, duration, etc.
- RDDs: partitions, memory used, disk used
- tasks: active, skipped, failed, total
- job stages: active, completed, skipped, failed
- and more
Turn it on
If you already use Datadog and Hadoop, you can turn on the integrations right now, and add Hadoop to the long list of technologies you can monitor easily and collaboratively. If you’re new to Datadog, here’s the link to a free trial.
