

NVIDIA Jetson is a family of embedded, low-power computing boards designed to support machine learning and AI applications at the edge. Organizations use Jetson boards for complex video and image processing and analysis, automating build processes in factories, and improving city infrastructures. For example, Jetson-based devices enable cities to analyze traffic patterns with their existing traffic cameras in order to find ways to improve their most congested intersections.
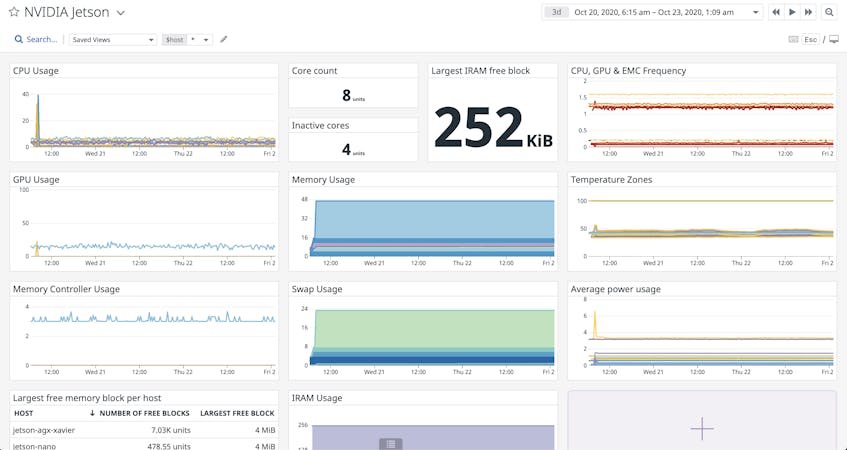
To help you monitor your fleet of Jetson devices, the Datadog IoT Agent now supports the current portfolio of Jetson boards, giving you even more visibility into your IoT environments. Datadog captures critical performance metrics from your Jetson hardware, including GPU utilization and frequency (i.e., GR3D), the amount of memory dedicated to the GPU (i.e., IRAM utilization), and external memory controller utilization (i.e., EMC). In addition to Jetson metrics, the IoT Agent automatically collects standard system metrics for CPU, memory, and network I/O, giving you deeper insight into what is happening on each of your devices. You can view all of these metrics in Datadog’s out-of-the-box Jetson dashboard, so you can get a high-level overview of your fleet.
End-to-end visibility into your device network
IoT networks can be a large and complex web of hundreds or thousands of devices, making it difficult to see how they connect to and support your services. Visibility into your entire network is important for quickly pinpointing issues such as a device that is performing poorly or unexpectedly goes offline, which can cause disruptions for your teams, their services, and your customers.
Datadog provides full visibility into your IoT network, so you can make informed decisions on how to maintain all of your devices. You can tag your devices with identifiers such as their geographic location to easily compare their performance using Datadog’s Host Map. For example, you can visualize your fleet’s GPU utilization across multiple locations in order to identify which devices need an upgrade in order to keep up with a service’s processing demand. This information can be invaluable for machine learning and computer vision use cases, where developers need to know how much their models are taxing the device.
You can also use Datadog to proactively monitor your network with alerts that automatically notify you when a device goes offline, or when there are unusual drops in a device’s GPU utilization.
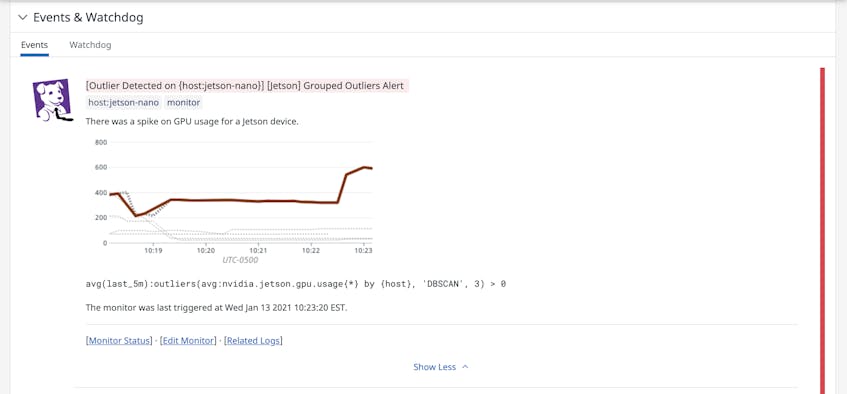
As seen in the example above, alert notifications can be customized to include device-specific tags, so you know exactly which devices in your fleet were affected and how to fix them.
Monitor the performance of your resource-intensive workflows
Jetson devices are ideal for processing video and image data. Since these types of processing jobs are resource intensive, it’s important that you have visibility into the health and performance of each of your devices to ensure they continue supporting your overall workflows.
With Datadog, you can monitor critical resource metrics for your devices, such as how much memory is allocated to a device and how much it is utilizing. This can help you determine if a device is reaching its limits for executing a complex processing job and needs to be upgraded. Datadog can also help you monitor the state of your devices after you’ve deployed an update to their software (e.g., video analytics or automation software).
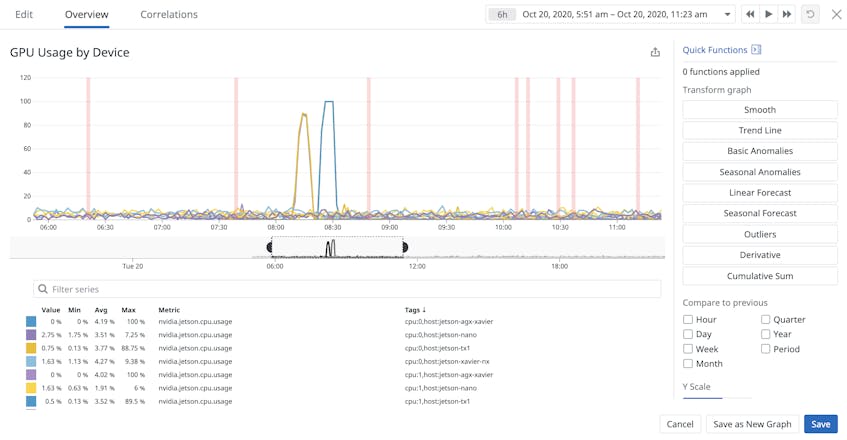
As seen in the example above, you can overlay events on a graph in order to track how specific events like a software update might have affected key device metrics (e.g., IRAM, EMC). A spike in IRAM metrics after an update, for example, could be an indicator that the update is consuming too much memory and needs to be rolled back.
As with tracking a device’s memory usage, monitoring its power consumption can also ensure that a fleet is optimized to support your services, and that its power usage stays within your team’s energy budget. With Datadog, you can quickly identify the source of unusual changes in a device’s energy usage.
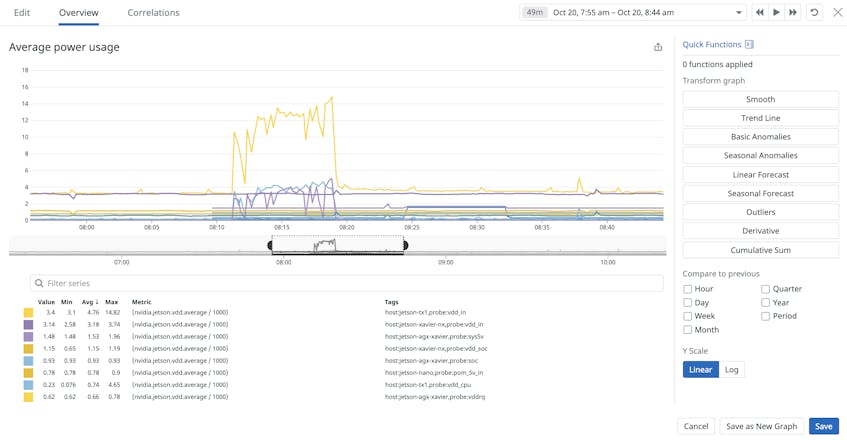
In the example above, you can see spikes in average power usage for several devices, which could be due to a resource-intensive processing job or inefficient hardware. You can quickly pivot to related logs to troubleshoot further and determine if you need to improve a processing workflow or schedule hardware upgrades (e.g., a new battery or radio) for the affected devices, ensuring that your fleet is working optimally.
Meet the Jetsons
The NVIDIA Jetson family of devices powers applications and robotics critical for improving manufacturing and shipping workflows and city infrastructures, use cases that require end-to-end visibility into device performance. With Datadog, you can monitor all of your Jetson-powered IoT devices and seamlessly correlate hardware metrics with other infrastructure metrics to ensure your devices and the systems they support are performing optimally. Check out our documentation to learn more. If you don’t already have a Datadog account, you can get started with a free 14-day trial today.
