Justin Slattery
Justin Slattery @jdslatts is the Sr. Director of Software Development at MLS Digital.
At Major League Soccer, we have been using Datadog in production for almost a year. Datadog has become our exclusive performance monitoring and graphing tool because it strikes the right balance between ease of use, flexibility, and extensibility and provides our team with tremendous leverage.
We love the fact that the Datadog team decided to make their agent an open-source project. This makes it super simple to create your own custom checks and contribute them back to the community. We did just that six months ago when we wrote a new check for Couchbase. The Couchbase integration we developed was based off of the existing CouchDB version. The custom check simply iterates through every possible metric available through the Couchbase REST API.
What is Couchbase?
If you haven’t heard of it before, Couchbase is a distributed NoSQL database. Despite a similar name and shared heritage, Couchbase is a very different product than the more widely recognized CouchDB. I won’t go into the differences between the two here, but if you haven’t heard of it before, Couchbase certainly is worth checking out. We have built several products on top of it, including our API and our real-time matchcenter Golazo.
Being able to monitor and profile Couchbase metrics alongside our application metrics has been critical to identify and resolve performance and availability issues in our products.
Key Couchbase Metrics to Monitor
To monitor Couchbase efficiently we need two different perspectives: the cluster as a whole and individual application buckets.
- At the cluster level, we want to identify which buckets are consuming the most resources.
- At the application level we want to know how many requests are not handled by upstream caching and are triggering Couchbase operations.
For cluster monitoring, we break metrics out by bucket so we can identify which buckets are under the most load. For application monitoring, we filter down to the appropriate buckets.
With Datadog we monitor the following metrics. For each metric you will find a short summary of what it measures, how to query for it in Datadog and an example to illustrate the metric.
Operations per second
In Datadog: couchbase.by_bucket.ops by {bucket}
What this measures: This straightforward metric simply measures the total number of gets, sets, incrs, and decrs happening on the bucket. This does not include any view operations. This measurement makes it easy to see which app/bucket is getting the most traffic and is helpful for capacity planning and issue triage.

View operations per second
In Datadog: couchbase.by_bucket.couch_views_ops by {bucket}
What this measures: In Couchbase, views are precomputed MapReduce index functions. This metric measures how many reads the views in each bucket are getting.

Current connections
In Datadog: couchbase.by_bucket.curr_connections by {host}
What this measures: This metric simply counts the number of connections per host. We use this metric to make sure we don’t have anything unexpected in our environment configuration such as forgetting to add one of the Couchbase nodes to the load balancer.
Total objects
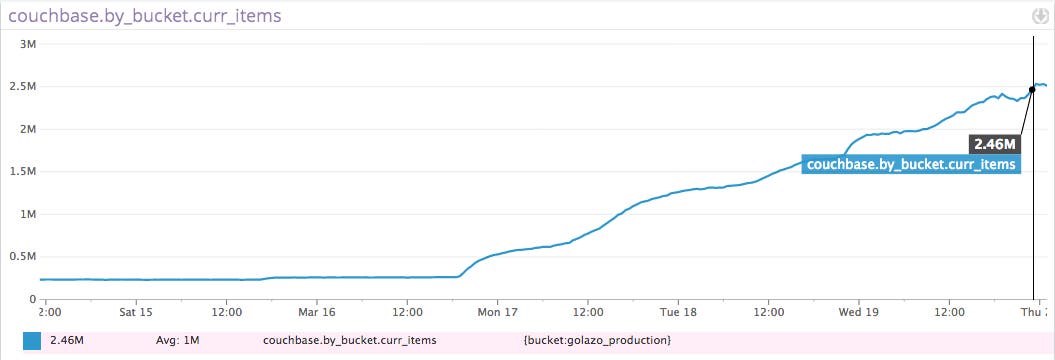
In Datadog: couchbase.by_bucket.curr_items by {bucket}
What this measures: This metric counts the total number of stored objects per bucket. We watch it to track growth rates of our buckets. A few of our buckets should never grow beyond a few thousand objects so increasing numbers on this graph would be a warning sign.
We actually just caught a serious problem in Golazo thanks to this metric. A runaway process started adding new objects to the bucket at an alarming rate. The graph below helped us catch the issue before it could cause an outage.

Resident item ratio
In Datadog: couchbase.by_bucket.vb_active_resident_items_ratio by {bucket}
What this measures: This number represents the ratio of items that are kept in memory versus stored on disk.
The expected value of this metric will vary by application. We expect some of our apps to stay around 100% and others hover more around 10%. Ideally you want this metric as close to 100% as possible so that your app’s most active objects are “hot” and won’t invoke a (much) slower disk read when requested.

Memory Headroom
In Datadog: couchbase.by_bucket.ep_mem_high_wat by {bucket} - couchbase.by_bucket.mem_used by {bucket}
What this measures: If the memory used is at the high water mark, then active objects will be ejected. Keeping track of this value gives you an indication of when you need to allocate more memory to a bucket. The bright line below shows that one of our buckets has no headroom. Not good.

Cache miss ratio
In Datadog: couchbase.by_bucket.ep_bg_fetched by {bucket} / (couchbase.by_bucket.cmd_get by {bucket} * 100)
What this measures: This composite metric counts the ratio requested objects fetched from disk as opposed to memory. This number should be as close to zero as possible. You can use it in conjunction with the resident items ratio and memory headroom metrics to understand if your bucket has enough capacity to store the most requested objects in memory.
The example below shows what it looks like when a bucket starts to run out of capacity to keep all active items in memory. This is the same bucket as above.

Disk reads per second
In Datadog: couchbase.by_bucket.ep_bg_fetched by {bucket}
What this measures: This metric is the raw number of disk fetches per second. This number is used in our cache miss rate calculation (above), but is worth watching on its own as well so that it is not masked by a higher number of gets per second. Again, this is the same bucket as above.

Ejections
In Datadog: couchbase.by_bucket.ep_num_value_ejects by {bucket}
What this measures: This measures the number of objects getting ejected out of the bucket. Any spike in this value could indicate that something is wrong, such as unexpected memory pressure for that bucket.
The example below shows what this looks like when it happens. This is the same bucket as the previous three graphs.

Disk write queue
In Datadog: couchbase.by_bucket.disk_write_queue by {bucket}
What this measures: Couchbase eventually persists all objects to disk. This queue measures how many of these objects are waiting to be written to disk. It should always be a low number. Growing larger over time would be an indication that the cluster is unhealthy. This graph below shows a temporary spike by one of our apps during a recent deployment with data migrations. A non-issue as long as the queue stays low/zero during normal load.

Out of memory errors
In Datadog: couchbase.by_bucket.ep_tmp_oom_errors by {bucket} and couchbase.by_bucket.ep_oom_errors by {bucket}
What this measures: These two metrics measure the number of times per second that a request is rejected due to memory pressure. Temp errors mean that Couchbase is making more room by ejecting objects and the request should be tried again later. Non-temp errors mean that the bucket is at the quota. Non-temp errors should trigger an alarm.
Couchbase Metrics & Datadog
Couchbase has a ton of other metrics that can be monitored and the Datadog integration exposes all of them. Luckily for us, the admin GUI already displays most of these metrics visually. Simply find a metric that you want to add to Datadog and hover over it. The tooltip will tell you what specifically is getting measured. If you’d like to gain this visibility, you can try Datadog for free for 14 days.
Couchbase also has great documentation. If you’re interested in learning more about these metrics or more about how Couchbase manages its memory and active working set, I recommend reading more about its architecture.
If you are interested in learning more about MLS Digital, check out our blog!


