
Microsoft Azure provides a suite of cloud computing services that allow organizations across every industry to deploy, manage, and monitor full-scale web applications. As you expand your Azure-based applications, securing the full scope of your cloud resources becomes an increasingly complex task. Azure platform logs record the who, what, when, and where of all user-performed and service account activity within your Azure environment. Collecting and analyzing Azure platform logs is vital for monitoring the security of your Azure assets and identifying potentially malicious activity before it can propagate across your system and cause serious issues.
In this guide, we’ll take a look at:
- the types and structure of Azure platform logs
- key Azure platform logs to monitor
- how Datadog can help you collect and monitor your Azure logs
But, before we jump into Azure logs, it’s important to understand the organizational hierarchy of your Azure resource directory, as it provides the foundation for properly interpreting and acting on those logs.

Azure uses Azure Active Directory (Azure AD) to manage identity and access management (IAM) across all resources within an organization, referred to as a tenant. To help structure which users and services have permission to access resources, Azure AD organizes a tenant’s cloud resources in a directory structure across four levels: management groups, subscriptions, resource groups, and resources. These levels act as a hierarchy, so permissions configured for an entity at a higher level apply to all sub-resources within that entity. At the very top of each tenant’s Azure AD hierarchy is a root management group, which controls global policies applied to the rest of the directory.
Azure AD creates a managed identity for every resource in your directory. The identity provides access credentials based on that resource’s resource group and subscription. When a user or resource attempts to perform an action (such as reading from a storage bucket or creating a VM), it requests an access token from Azure AD, which is used to authenticate the request. The request is logged and contains detailed information about the action performed in your environment.
Understanding Azure platform logs
Microsoft Azure generates three categories of platform logs that record different types of actions:
- Azure Active Directory reports detail changes made in Azure AD and login activity.
- Activity logs record operations performed on an Azure resource (i.e., operations coming from the the control plane), such as creating a VM. Activity logs also record Service Health events.
- Resource logs capture operations performed within an Azure resource (i.e., operations coming from the data plane), such as querying a database or writing to a storage bucket.
In the following sections, we’ll look at each type of log and how you can differentiate between them by looking at the category field that Azure includes in all logs.
Active Directory reports
Azure Active Directory logs detail all authentication activity related to your AD users and their access to resources, and thus help you track key information like which users are using resources, which administrators have delegated permissions to users, and which users are potential security concerns. You can view Azure AD logs directly within the AD portal.
There are two subtypes of Azure AD logs: activity logs and security reports. Activity logs record the actions of users in your organization, such as sign-ins, as well as all user credential changes. Activity logs recording user sign-ins will have Sign-In as their Category field, while credential changes will have Policy.

Security reports record any instances of unusual (and potentially malicious) user activity, such as multiple failed sign-ins or access from a new country. Similarly, these logs will also have Sign-In or Audit logs as their category type respectively.
Activity logs
Azure activity logs (not to be confused with the AD activity log subtype) record either creates and changes (i.e., PUT, POST, and DELETE operations) performed on the resources within your Azure subscriptions, such as starting a virtual machine or editing the configuration of an Azure Pipeline. Each activity log contains key information on the particulars of the event, including which user (if any) performed the operation, which resource the operation was attempted on, when the operation occurred, and whether it was successful. There are multiple categories of activity logs, but the majority of actions on your subscription-level assets will be related to configuration changes, so you likely will most frequently see ‘Administrative’ or ‘Policy’ values in the Category field.
In order to store and access your activity logs, you need to create a workspace in Log Analytics, Azure’s log management tool. Once you’ve done this, you can access your logs in the Azure portal using the side navigation bar, or with the Azure CLI.
The abridged sample below shows an Administrative type activity log in which Caller: john.doe@datadoghq.com.onmicrosoft.com has successfully updated a network security group ("authorization.action": "Microsoft.Network/networkSecurityGroups/write"). The log’s authorization.scope field also tells us which subscription and resource group the network security group is a part of, which can help us discern which access permissions allowed the user to make the configuration changes.
{
   "authorization": {
       "action": "Microsoft.Network/networkSecurityGroups/write",
       "scope": "/subscriptions/12345678-1234-1234-1234-123456789101/resourcegroups/stanfield/providers/Microsoft.Network/networkSecurityGroups/Jumpbox-nsg"
   },
   "caller": "john.doe@datadoghq.onmicrosoft.com",
   "channels": "Operation",
   [...]
   "category": {
       "value": "Administrative",
       "localizedValue": "Administrative"
   },
   "eventTimestamp": "2021-02-25T14:14:37.4666455Z",
   "id": "/subscriptions/12345678-1234-1234-1234-123456789101/resourcegroups/stanfield/providers/Microsoft.Network/networkSecurityGroups/Jumpbox-nsg/events/306b539b-397d-4bd1-9364-61f1cb4bbab7/ticks/637498592774666455",
   "level": "Informational",
   "operationId": "cf187bda-b64d-4221-bae6-d3d71b067fac",
   "operationName": {
       "value": "Microsoft.Network/networkSecurityGroups/write",
       "localizedValue": "Create or Update Network Security Group"
   },
   "resourceGroupName": "stanfield",
   "resourceProviderName": {
       "value": "Microsoft.Network",
       "localizedValue": "Microsoft.Network"
   },
   "resourceType": {
       "value": "Microsoft.Network/networkSecurityGroups",
       "localizedValue": "Microsoft.Network/networkSecurityGroups"
   },
   "resourceId": "/subscriptions/12345678-1234-1234-1234-123456789101/resourcegroups/stanfield/providers/Microsoft.Network/networkSecurityGroups/Jumpbox-nsg",
   "status": {
       "value": "Succeeded",
       "localizedValue": "Succeeded"
   },
   "subStatus": {
       "value": "",
       "localizedValue": ""
   },
   "submissionTimestamp": "2021-02-25T14:15:38.1594455Z",
   "subscriptionId": "12345678-1234-1234-1234-123456789101",
   "tenantId": "98765432-9876-9876-9876-987654321098",
   "properties": {
       "eventCategory": "Administrative",
       "entity": "/subscriptions/12345678-1234-1234-1234-123456789101/resourcegroups/stanfield/providers/Microsoft.Network/networkSecurityGroups/Jumpbox-nsg",
       "message": "Microsoft.Network/networkSecurityGroups/write",
       "hierarchy": "98765432-9876-9876-9876-987654321098/12345678-1234-1234-1234-123456789101"
   },
   "relatedEvents": []
}
Resource logs
Resource logs detail all of the actions that occur within an existing Azure resource, such as reads and writes to a vault in Azure Key Vault, or to a database in Azure SQL Database. Like activity logs, resource logs each contain a schema of standardized fields that provide key information such as the ID of the resource in which the request was made (as well as the IDs of the subscription and resource group to which the resource belongs), the timestamp of the request, and whether or not the request succeeded. Like activity logs, you need to create a Log Analytics workspace In order to store and access your resource logs.
Because there are so many types of resource logs, it’s best to assume that any log with a Category type not mentioned in the above Azure AD and activity log sections is a resource log. Resource log categories depend on the type of resource being modified and are often descriptive of the “scope” of the actions taken, such as Execution or Request. For a full list of resource log categories, see Azure’s documentation.
It’s important to note that, unlike Azure AD and activity logs, Azure services do not emit resource logs by default due to their volume. In order to enable resource log collection, you need to create a diagnostic setting for each resource and designate which Log Analytics workspace will receive its logs. We’ll look at this process later in this post.
The following abridged sample resource log shows that caller: john.doe@datadoghq.onmicrosoft.com successfully added a new key (OperationNameValue: Microsoft.KeyVault/vaults/write) to an instance of Azure Key Vault.
{
   "authorization": {
       "action": "Microsoft.KeyVault/vaults/write",
       "scope": "/subscriptions/12345678-1234-1234-1234-123456789101/resourcegroups/stanfield/providers/Microsoft.KeyVault/vaults/sekret"
   },
   "caller": "john.doe@datadoghq.onmicrosoft.com",
   "channels": "Operation",
[...]
   "description": "",
   "eventDataId": "8912ad72-5a13-4b09-8d0f-d4d62319be5d",
   "eventName": {
       "value": "EndRequest",
       "localizedValue": "End request"
   },
   "category": {
       "value": "Administrative",
       "localizedValue": "Administrative"
   },
   "eventTimestamp": "2021-02-26T18:56:41.6480881Z",
   "id": "/subscriptions/12345678-1234-1234-1234-123456789101/resourcegroups/stanfield/providers/Microsoft.KeyVault/vaults/sekret/events/8912ad72-5a13-4b09-8d0f-d4d62319be5d/ticks/637499626016480881",
   "level": "Informational",
   "operationId": "5fb0b823-f5d4-4278-98b3-25d84a06a87f",
   "operationName": {
       "value": "Microsoft.KeyVault/vaults/write",
       "localizedValue": "Update Key Vault"
   },
   "resourceGroupName": "stanfield",
   "resourceProviderName": {
       "value": "Microsoft.KeyVault",
       "localizedValue": "Microsoft.KeyVault"
   },
   "resourceType": {
       "value": "Microsoft.KeyVault/vaults",
       "localizedValue": "Microsoft.KeyVault/vaults"
   },
   "resourceId": "/subscriptions/12345678-1234-1234-1234-123456789101/resourcegroups/stanfield/providers/Microsoft.KeyVault/vaults/sekret",
   "status": {
       "value": "Accepted",
       "localizedValue": "Accepted"
   },
   "subStatus": {
       "value": "OK",
       "localizedValue": "OK (HTTP Status Code: 200)"
   },
   "submissionTimestamp": "2021-02-26T18:57:36.1579484Z",
   "subscriptionId": "12345678-1234-1234-1234-123456789101",
   "tenantId": "98765432-9876-9876-9876-987654321098",
   "properties": {
       "statusCode": "OK",
       "serviceRequestId": "6f1140e7-57b3-4002-823c-deb47b0615e7",
       "eventCategory": "Administrative",
       "entity": "/subscriptions/12345678-1234-1234-1234-123456789101/resourcegroups/stanfield/providers/Microsoft.KeyVault/vaults/sekret",
       "message": "Microsoft.KeyVault/vaults/write",
       "hierarchy": "98765432-9876-9876-9876-987654321098/12345678-1234-1234-1234-123456789101"
   },
   "relatedEvents": []
}
Interpreting your Azure platform logs
While each type of Azure log has unique fields, all of them share some common information that is invaluable for helping you track the actions occurring in your environment. First a foremost, the caller field is universal and gives you the identity of the user or service that performed the logged action. Similarly, as discussed in the sections above, each log has a category field that helps you determine its log type: AD logs have Sign-in, Policy, or Audit logs as their category field, activity logs will most likely have Administrative or Policy as their category field, and resource logs will have anything else. Again, there are some exceptions, but this is a useful rule of thumb for interpreting most of your Azure logs.
Azure activity and resource logs also include information on the resource that was interacted with, including its associated ResourceGroup, SubscriptionId, and ResourceId. You can use these values to discern where the permission configurations attached to a resource are coming from, and thus how a user or service was able to interact with them based on their own permission configurations. This way, you can spot users that have overreaching permissions.
Finally, each log contains the name of the operation performed (OperationName), the status of the operation (ActivityStatus), the time at which the request was made (TimeGenerated), and a unique OperationId. You can use the operation ID to track the operation later, or include the operation’s details in later API calls.
In the following sections, we’ll look at some of the most important Azure platform logs of each type, and discuss how monitoring them can help you keep your environment as secure as possible.
Key Azure platform logs to monitor
Because Azure generates platform logs for nearly every action that occurs across your directories, it can be difficult to sift through the massive quantity of logs and find the ones that are useful for detecting threats. In this section, we’ll look at some of the most important platform logs and consider the best approaches to remediating the threats they may represent. In particular, we’ll cover two main types of logs that can alert you to different types of potential vulnerabilities:
Authentication logs
Your Azure Active Directory and activity logs provide a record of user activity, including all successful and unsuccessful login events. These logs are invaluable for detecting suspicious login activity. One example of this is a brute force attack, in which an attacker repeatedly attempts to guess a user’s login credentials. When Azure records a failed login attempt, the resulting Azure AD log will have a category of SignInLog. If a user’s login attempts fail (outcome: failure) multiple times in a row, you should investigate the rest of the logs’ details.
Of course, multiple login attempts are not always indicative of a brute force attack; the user may have legitimately forgotten their credentials. But it’s worth determining if the user was compromised and potentially rotating their credentials. In the following logs, we can see that a user failed multiple single-factor authentication attempts in a row; however, because they then successfully logged in with multi-factor authentication, we know that this was not the work of an attacker.

Another sign of potential nefarious login activity is when a user (or multiple users) fails to successfully complete multi-factor authentication when logging in. Azure AD logs indicating this always have an authenticationRequirement: multiFactorAuthentication field with outcome:failed as a subfield. Again, such logs are not always indicative of a threat, but it’s worth setting an alert to notify you whenever they’re produced.
Resource-based logs
When attempting to gain persistence in your Azure environment, an attacker will often begin by trying to find instances of the following types of resources that have overly permissive access policies attached to them:
- Azure roles including user, Active Directory administrator, and classic subscription administrator
- Virtual Machines and other compute resources
- Azure Storage objects, such as blobs, files, disks, etc.
- Network security groups
Once an attacker finds a misconfigured resource, they can then read or modify its contents, exfiltrate its sensitive data, or escalate its access policies to allow for further exploitation. The most vulnerable resources are those that are accessible from the public internet, so you may consider enabling resource logging on them and closely monitoring the logs that they emit.
For instance, you might have a network security group that’s open to inbound traffic from all IP addresses. If the group is mistakenly associated with a network interface that’s meant for private communications, an attacker could exploit the misconfiguration and gain further access to your network. In this case, it’s important to look out for resource logs that record action: Microsoft.Network/networkSecurityGroups/write and sourceAddressPrefix values of 0.0.0.0 or *, such as the sample log below.
Similarly, it’s worth inspecting activity logs that detail instances of creating or modifying security groups or security group rules, as these logs may represent an attacker delegating overreaching permissions to themselves. In the following log snippet, user john.doe@datadoghq.onmicrosoft.com has initiated an update to a security group ("operationName": { "value": "Microsoft.Network/networkSecurityGroups/securityRules/write", "localizedValue": "Create or Update Security Rule" }) called Jumpbox-nsg.
{
   "authorization": {
       "action": "Microsoft.Network/networkSecurityGroups/securityRules/write",
       "scope": "/subscriptions/12345678-1234-1234-1234-123456789101/resourceGroups/stanfield/providers/Microsoft.Network/networkSecurityGroups/Jumpbox-nsg/securityRules/Port_8080"
   },
   "caller": "john.doe@datadoghq.onmicrosoft.com",
   "channels": "Operation",
[...]
     "correlationId": "405fe015-c0e1-41af-8b7d-bf92076d6650",
   "description": "",
   "eventDataId": "7495ef59-0d7a-41a5-80e2-e033c0356b2a",
   "eventName": {
       "value": "BeginRequest",
       "localizedValue": "Begin request"
   },
   "category": {
       "value": "Administrative",
       "localizedValue": "Administrative"
   },
   "eventTimestamp": "2021-02-25T20:36:51.5686671Z",
   "id": "/subscriptions/12345678-1234-1234-1234-123456789101/resourceGroups/stanfield/providers/Microsoft.Network/networkSecurityGroups/Jumpbox-nsg/securityRules/Port_8080/events/7495ef59-0d7a-41a5-80e2-e033c0356b2a/ticks/637498822115686671",
   "level": "Informational",
   "operationId": "405fe015-c0e1-41af-8b7d-bf92076d6650",
   "operationName": {
       "value": "Microsoft.Network/networkSecurityGroups/securityRules/write",
       "localizedValue": "Create or Update Security Rule"
   },
   "resourceGroupName": "stanfield",
   "resourceProviderName": {
       "value": "Microsoft.Network",
       "localizedValue": "Microsoft.Network"
   },
   "resourceType": {
       "value": "Microsoft.Network/networkSecurityGroups/securityRules",
       "localizedValue": "Microsoft.Network/networkSecurityGroups/securityRules"
   },
   "resourceId": "/subscriptions/12345678-1234-1234-1234-123456789101/resourceGroups/stanfield/providers/Microsoft.Network/networkSecurityGroups/Jumpbox-nsg/securityRules/Port_8080",
   "status": {
       "value": "Started",
       "localizedValue": "Started"
   },
   "subStatus": {
       "value": "",
       "localizedValue": ""
   },
   "submissionTimestamp": "2021-02-25T20:37:51.1436369Z",
   "subscriptionId": "12345678-1234-1234-1234-123456789101",
   "tenantId": "98765432-9876-9876-9876-987654321098",
   "properties": {
       "requestbody": "{\"properties\":{\"protocol\":\"*\",\"sourcePortRanges\":null,\"sourcePortRange\":\"*\",\"sourceAddressPrefixes\":null,\"sourceAddressPrefix\":\"*\",\"destinationPortRanges\":null,\"destinationPortRange\":\"8080\",\"destinationAddressPrefixes\":null,\"destinationAddressPrefix\":\"*\",\"access\":\"Allow\",\"priority\":310,\"direction\":\"Inbound\",\"sourceApplicationSecurityGroups\":[],\"destinationApplicationSecurityGroups\":[]},\"id\":\"/subscriptions/12345678-1234-1234-1234-123456789101/resourceGroups/stanfield/providers/Microsoft.Network/networkSecurityGroups/Jumpbox-nsg/securityRules/Port_8080\",\"name\":\"Port_8080\"}",
       "eventCategory": "Administrative",
       "entity": "/subscriptions/12345678-1234-1234-1234-123456789101/resourceGroups/stanfield/providers/Microsoft.Network/networkSecurityGroups/Jumpbox-nsg/securityRules/Port_8080",
       "message": "Microsoft.Network/networkSecurityGroups/securityRules/write",
       "hierarchy": "98765432-9876-9876-9876-987654321098/12345678-1234-1234-1234-123456789101"
   },
   "relatedEvents": []
}
Because Azure emits such a large volume of logs, it can be difficult to get a big-picture perspective of the activity in your environment. For this reason, it’s best to use a third-party log management solution. In the following section, we’ll look at how to export Azure logs, and how Datadog can help you get the most context out of your logging inventory.
Shipping your Azure platform logs
While there are multiple ways to ship your platform logs to third-party applications, Azure recommends using Event Hubs, which are distributed data streaming pipelines that can handle the large volume of platform logs generated by your Azure environment. Event Hubs let you to ship your logs in near real-time, and using Datadog’s Event Hub integration, you can easily keep track of the health of your Hubs and make sure that you’re receiving your logging data as instantaneously as possible.
In the next section, we’ll look at the benefits of using Datadog to manage and analyze your Azure platform logs, including multiple features that help you monitor these critical logs and use them to alert you to these potential threats. We’ll also go over how to set up an Event Hub and configure it to send your logs to Datadog.
Collect and analyze Azure platform logs with Datadog
There are a number of benefits that come with using Datadog as your log monitoring platform, including:
- Datadog’s Azure integration that collects data from all of your Azure services, including Virtual Machine, Load Balancer, Event Hub, and SQL Database
- automatic parsing and enrichment of your Azure platform logs via Datadog’s log processing pipeline
- cost-effective collection and archiving of all you Azure platform logs using Logging without Limits™
- built-in security and compliance analysis across all of your logs
Once you’re collecting your Azure platform logs with Datadog, you can build custom dashboards that visualize log data for a full-picture perspective of your Azure environment’s activity. Datadog’s built-in Threat Detection Rules automatically watch your logs for potential malicious activity, including the key events we’ve discussed, so you are notified as soon as security and compliance issues occur.
Export your Azure platform logs to Datadog
After you’ve enabled Datadog’s Azure integration, the next step is to create an Azure Event Hub instance to start streaming your platform logs to Datadog. Finally, configure your resources’ diagnostic setting to send their logs to the Event Hub instance so that they will be forwarded on to Datadog.
To simplify this set-up process, Datadog provides an automated script that creates and configures all of the necessary resources in your Azure account and links them to a new Event Hub instance that forwards to Datadog. To use this script, open Cloud Shell in Azure and run the following two commands.
The first command downloads the resource automation script:
(New-Object System.Net.WebClient).DownloadFile("https://raw.githubusercontent.com/DataDog/datadog-serverless-functions/master/azure/eventhub_log_forwarder/activity_logs_deploy.ps1", "activity_logs_deploy.ps1")Use the second command to run that script, substituting <api_key> with your Datadog API key and <subscription_id> with your Azure Subscription ID:
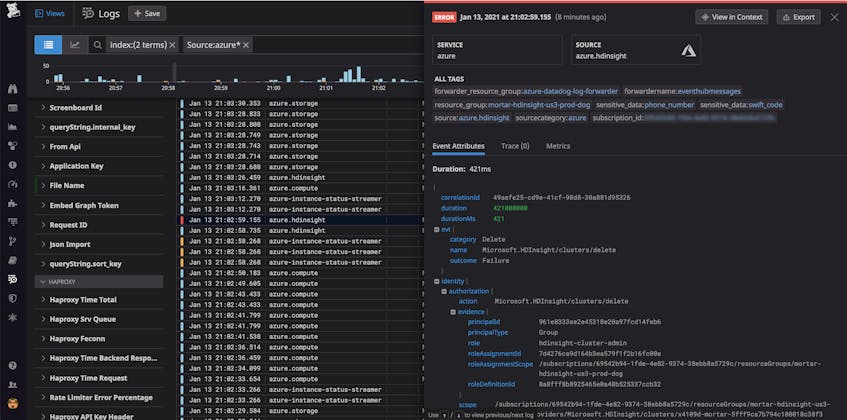
./activity_logs_deploy.ps1 -ApiKey <api_key> -SubscriptionId <subscription_id>Upon successful configuration, you’ll start to see your Azure platform logs appear in real time in Datadog’s Log Explorer. Datadog’s log processing pipeline automatically parses metadata from your Azure platform logs and uses it to create log attributes, which you can use as tags to quickly filter, sort, and group your logs by key facets like service, action, user, subscription, and resource group.
Get a full-picture perspective on log activity
In order to get a high-level overview of your Azure platform logs, you can build dashboards that visualize your most important log events. By filtering on the attributes mentioned above, you can create custom data visualizations, such as a list of Azure users that are most frequently failing login attempts.
Detect security threats in real time
To help you catch security threats to your Azure environment as quickly as possible, Datadog Cloud SIEM lets you apply detection rules to your Azure platform logs as they are ingested. Out-of-the-box Azure detection rules match the attack techniques standardized in the MITRE ATT&CK® framework, which covers some of the important log events we looked at above. You can also create custom rules to look for malicious behavior that is specific to your environment.
Whenever an incoming Azure platform log matches the logic of a rule, Datadog creates a Security Signal. You can browse all of the signals created against your Azure logs in the Security Signals explorer, where each signal contains information on the incident, including a timeline of the threat’s detection and a brief recommendation on how to best remediate it. This makes it easy to triage threats and focus on the most urgent ones.

Start monitoring your Azure platform logs with Datadog
In this post, we reviewed how Azure platform logs are organized, how the hierarchy of Azure environments affects their contents, and how to analyze each type of platform log to get visibility into activity across your Azure services. We also looked at some of the most important logs to watch in order to secure your environment, as well as how Datadog Cloud SIEM can help your organization triage your logs and catch such security issues as they occur. For more information on the benefits of monitoring your Azure platform logs with Datadog, check out our Azure documentation. If you’re not already using Datadog, get started now with a 14-day free trial.
