Dhruv Sahni

Mallory Mooney
AWS CloudFormation is a service that enables you to build infrastructure as code, similar to Terraform. You can create CloudFormation templates to provision and manage all of the resources for your stacks, such as EC2 instances, load balancers, and security groups. These templates automate the process of building infrastructure, creating repeatable steps that you can easily check into version control. This ensures that your configurations do not drift with each new environment you spin up.
While you can already use CloudFormation to automate steps such as installing the Datadog Agent on your instances, Datadog has collaborated with AWS to create even more resources that are available on the CloudFormation registry for use in your templates. Now you can add Datadog resources directly to your templates via the CloudFormation registry’s public extensions, enabling you to reference the entire schema of a Datadog resource and automatically update it as new versions become available. This makes it easier than ever to manage Datadog components as code and get real-time visibility into your CloudFormation applications.
You can use Datadog’s resources to automatically:
- enable Datadog’s AWS integration
- create, update, and delete monitors for your services
- schedule downtime for monitors
- manage users for your Datadog account (available as a private resource)
- create and manage dashboards
Below, we’ll walk through a few examples of how you can start using Datadog’s CloudFormation resources to build a reliable, repeatable process for monitoring your infrastructure in real time.
Get started with Datadog’s CloudFormation resources
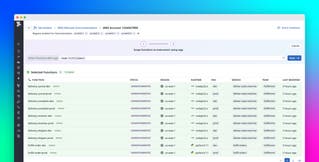
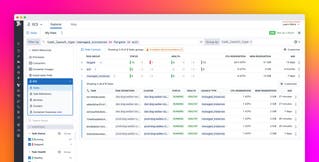
You now have the option to use the AWS Management Console as well as the AWS CLI to register Datadog’s resources to your account. To activate and register Datadog resources via the AWS Console, sign in to your account and navigate to the CloudFormation service. You can then select “Public extensions,” filter by “Third party” publisher, and use the “Extensions” search bar to search for the “Datadog” prefix.
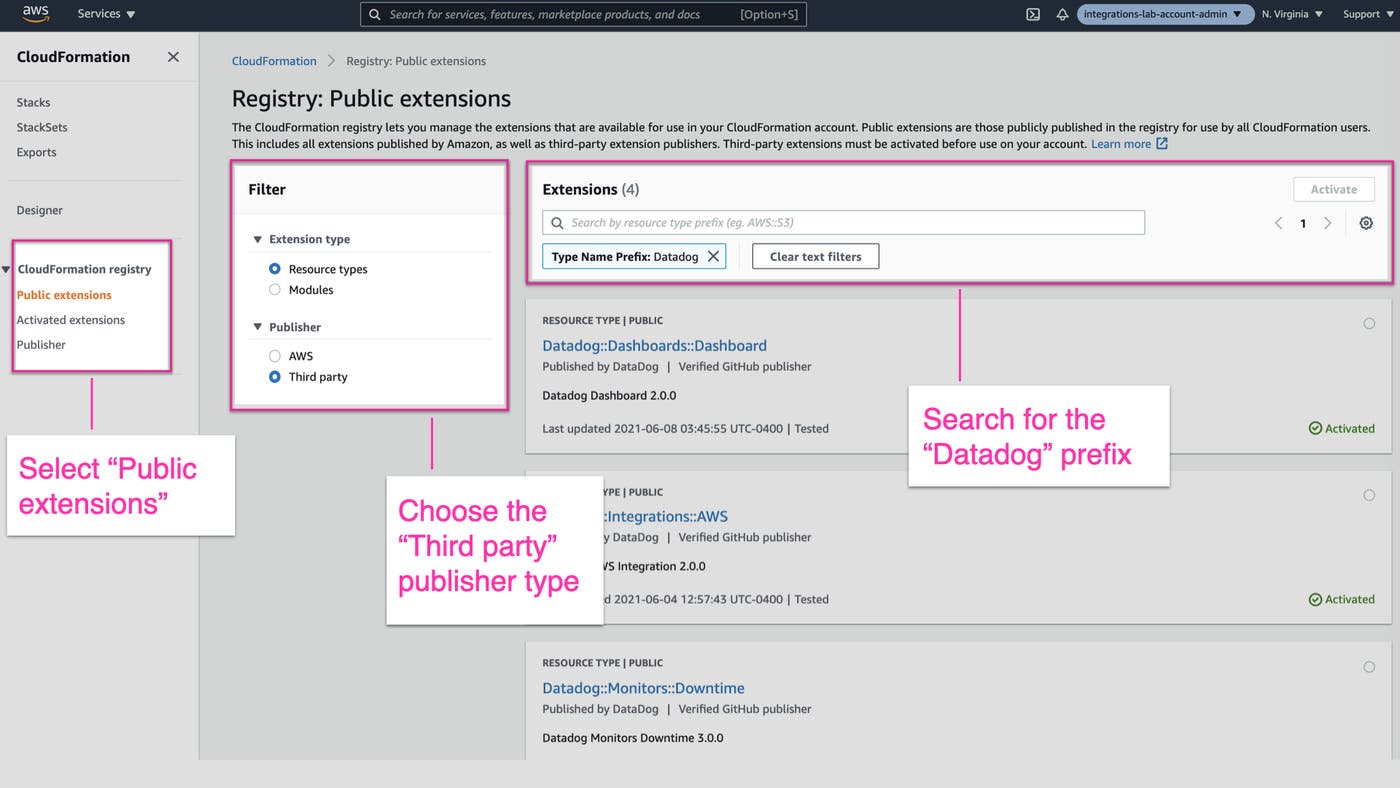
You can click on the desired resource to view more information, such as the full resource and configuration schemas. From here, you can then click on the “Activate” button to follow the prompts for registering the resource to your account. Once you register these resources and configure them with your Datadog credentials, you can incorporate them into your new and existing CloudFormation templates, whether you’re building them from scratch or using CloudFormation’s template designer.
For more details about Datadog resource activation and configuration, as well as instructions on using the AWS CLI to register Datadog resources, check out our documentation.
Automatically enable Datadog’s AWS integration
To start monitoring the resources in your CloudFormation stacks, you can add Datadog’s AWS Integration resource to your CloudFormation templates to automatically enable Datadog’s AWS integration:
Resources: DatadogAWSIntegrationResource: Type: 'Datadog::Integrations::AWS' Properties: AccountID: <AWS_ACCOUNT_ID> RoleName: DatadogAWSIntegrationRole HostTags: ["env:staging", "team:devops"] AccountSpecificNamespaceRules: {"ec2": true, "api_gateway": false}This example assumes that you’ve configured role delegation using AWS IAM, so the Datadog role (e.g., DatadogAWSIntegrationRole) has read-only access to your AWS account. You can use this resource in templates to automatically enable the AWS integration, configure your account ID, tags, new role, and any namespace rules such as enabling metric collection for a specific integration (e.g., EC2). You can check out the resource’s documentation for examples and a list of available properties. CloudFormation templates also support dynamic references so you can store your keys in a service like AWS Secrets Manager.
Create and manage dashboards
Once you’ve enabled the AWS integration, you can use Datadog’s Dashboard resource to create and manage dashboards for your applications or services, so you can instantly monitor key performance metrics and troubleshoot issues. For example, if you have built a custom dashboard for an application that uses multiple AWS services, you can export the dashboard definition as JSON and embed it in your CloudFormation template.
Resources: DatadogTestDashboard: Type: 'Datadog::Dashboards::Dashboard' Properties: DashboardDefinition: | <Insert the JSON string of the dashboard definition>Create alerts for your resources
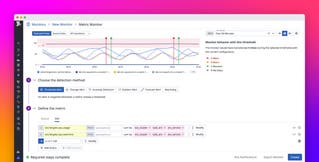
With Datadog’s Monitor resource, you can quickly create new alerts for your applications, or update and delete existing alerts. For example, you can create an alert that notifies you when an EC2 instance goes down in the us-east-1 region by adding the following to your CloudFormation template:
Resources: DatadogMonitorResource: Type: 'Datadog::Monitors::Monitor' Properties: Type: service check Query: '"aws.ec2.host_status".over("region:us-east-1").by("host").last(4).count_by_status()' Name: EC2 Uptime/Availability Message: "An EC2 instance in the us-east-1 region is offline."You can use Datadog’s Monitor resource to create alerts for any application metric, not just AWS metrics. This enables you to instantly create alerts for every service in your infrastructure.
Datadog’s Downtime resource allows you to schedule downtime for your monitors if you need to mute alert notifications (e.g., during maintenance windows), as shown in the example below.
Resources: DatadogDowntimeUntilDate: Type: 'Datadog::Monitors::Downtime' Properties: Message: "Instances in the us-east-1 region will be offline for weekend maintenance. Monitoring notifications will be suspended from 10/18/2019 9:00PM to 10/19/2019 12:00PM." MonitorId: <DATADOG_MONITOR_ID> Scope: ["*"] Start: 1571432400 End: 1571486400 Timezone: "EST"This configures CloudFormation to automatically create a new downtime schedule in your Datadog account, as seen below. You can find more examples and a list of available properties for the Downtime resource in our documentation.
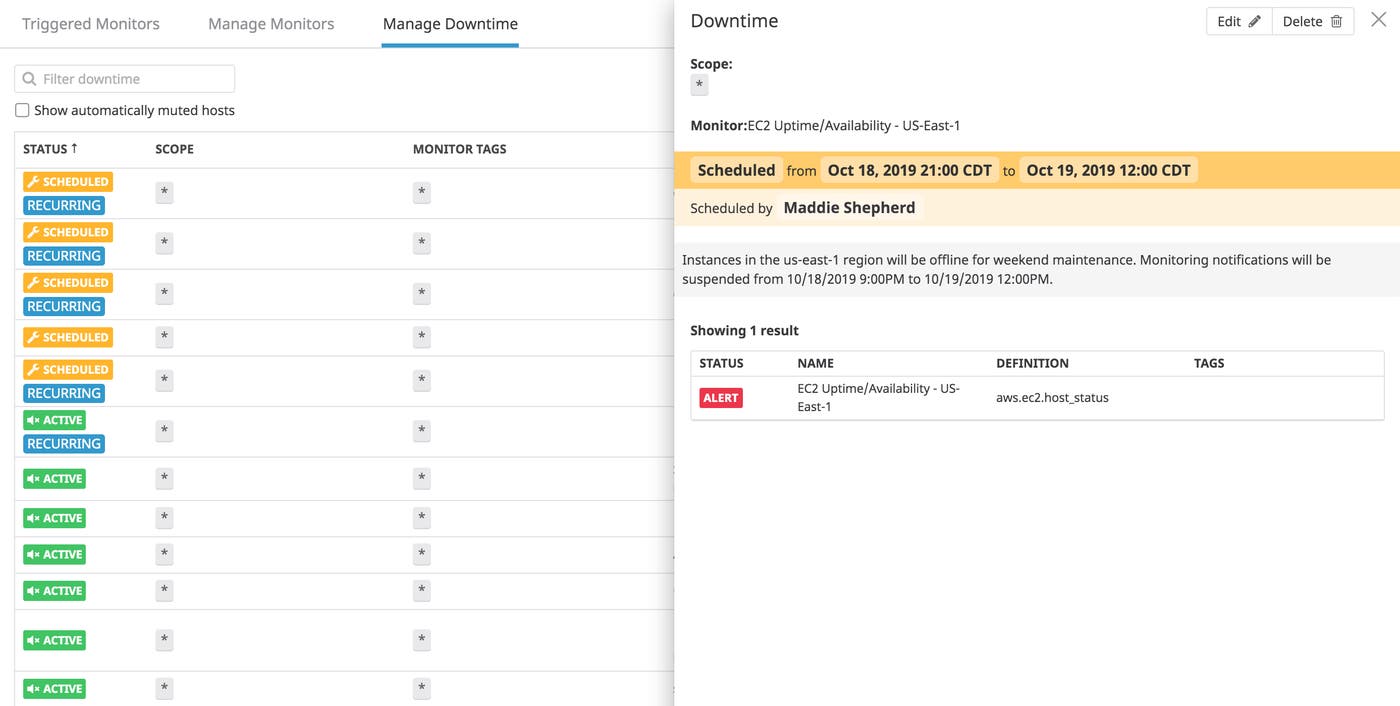
These resources enable you to immediately begin alerting on potential issues in your environment—and give you a way to automatically configure downtime for alerts. This helps limit gaps in coverage in newly deployed infrastructure components and eliminates the need to manually set up alerts.
Monitoring as code with Datadog and CloudFormation
With Datadog and CloudFormation, you can create repeatable steps for provisioning and setting up monitoring for all of your resources. These resources build upon our existing support for CloudFormation so you can automate more of the setup process, including installing the Datadog Agent to collect metrics and logs from your instances. Check out our documentation to learn more about how you can use Datadog and CloudFormation to automatically deploy, manage, and monitor your stacks. If you don’t already have a Datadog account, you can sign up for a free 14-day trial.
